Celldex Therapeutics, Inc. (CLDX)-Nasdaq
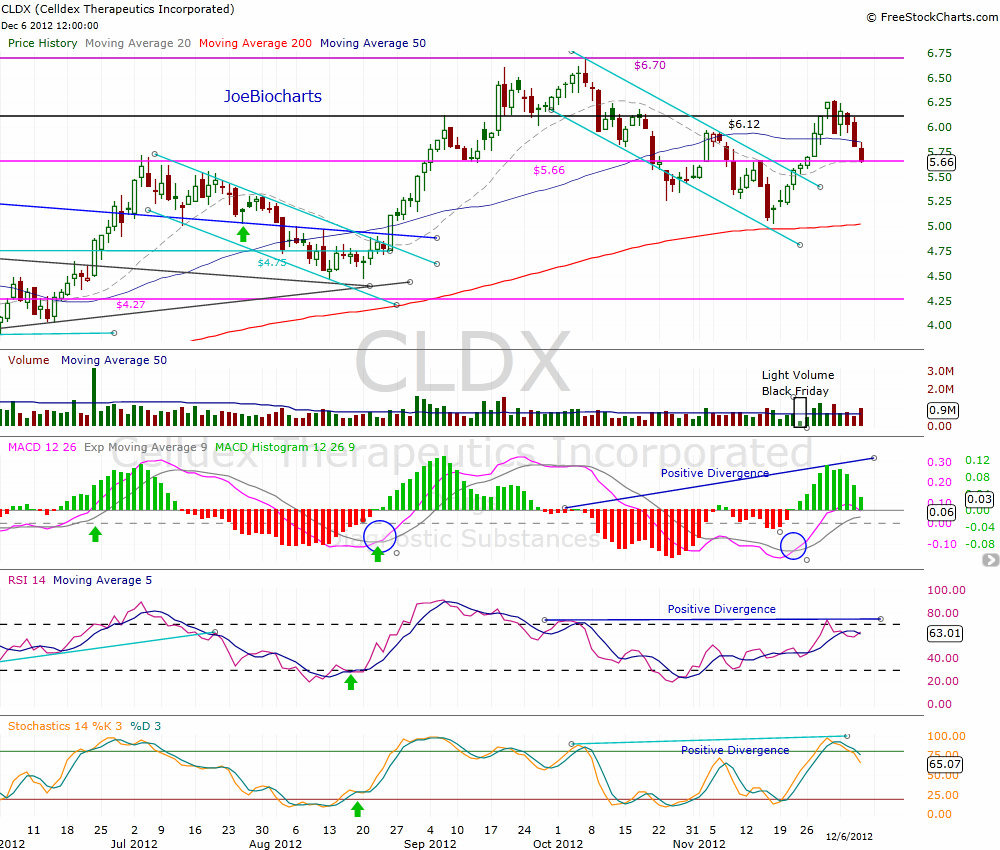
CLDX’s chart is one of a kind and very easy to understand even by a novice chart technician. It has been repeating the same moves, creating a pattern that makes it easy to predict, using a historical resistance & support lines to find the points of the reversals.
Starting in June 2012 around the $4 point, CLDX had an impressive run to reach the weekly resistance line $5.66. Amazingly the price stopped just below the resistance line, turning back and correcting, running down in a downtrend channel. It reached the support line (black line from historical triangle formation) and again started a new uptrend. During the second run (started in late August) the price broke out of through the old $5.66 resistance line with large volume and was supported with a positive momentum keep running up. It reached the next weekly resistance line at $6.70, a new 52 week high.
After reaching the 52 weeks high, we can see the bearish candlestick “Shooting Star” triggering a new downtrend. History repeats itself, as we had back during July – August, the price started again trading in a downtrend channel, reaching the low of $5.02. It came very close to the 200MA that supposed to be used as a support line, at that point, after getting a reversal candlestick called ” Doji Star”. The price breakout in the downtrend channel to start a new uptrend.
If we look at the MACD it’s easy to see the correlation with the price action. Look at the two points of the reversal, marked with the blue circles, giving us the technicians the right signal of the coming uptrend after the reversal pattern or candlestick.
Now let’s see if the history will repeats itself again and the new uptrend started in 11/16 will breakout the last resistance line at $6.70 and reach a new 52 weeks high, supported with a clear positive divergence in all the three indicators, MACD, RSI & the Stochastics. Positive Divergence is a condition when the price has a lower low or a lower high but the indicator measuring the same price doesn’t, instead it has a higher high. This usually implies that the selling strength is weakening.
Besides the technicals, we know how important the fundamentals and news effect the price action, especially in the biotechnology sector. With a significant data release at the San Antonio Breast Conference Symposium (SABCS12) this weekend, Celldex will be under a spotlight. This data will determine the price action. In the case of positive data, we will see a continuation of the last uptrend reaching a new high, but in case of negative data, this could could be the start of a new downtrend. See Patrick’s report for updated on what to expect from this weekend’s EMERGE data release (link).
Disclosure: Author Long $CLDX


