ZIOPHARM Oncology, Inc. (ZIOP)-Nasdaq
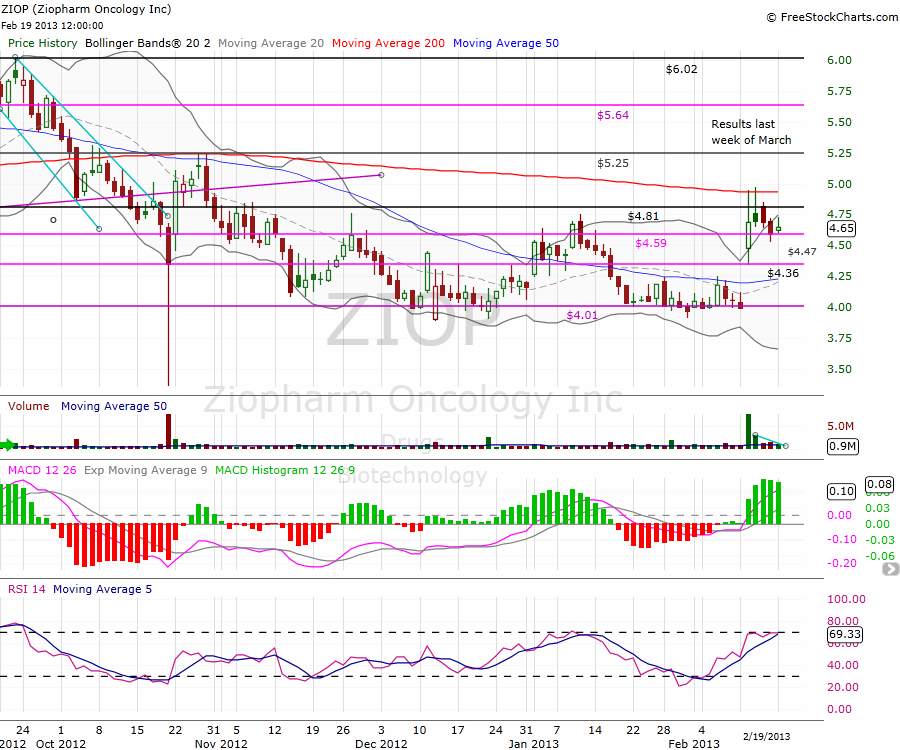
Since November 11, 2012 ZIOP was trading in a horizontal channel, the upper resistance line at $4.81 and the lower support line at $4.01, till February 12, 2013, the day ZIOP announced that the Phase 3 (PICASSO 3) trial of palifosfamide (ZIO-201) in first-line metastatic soft tissue sarcoma has reached its target number of PFS events. The Company is expected to announce top line results from this trial during the last week of March.
Key events – The key catalyst for ZIOP shares is expected in March, when topline Phase 3 PFS data from the PICASSO 3 trial evaluating palifosfamide in STS is expected to be announced. In addition, Phase 2 data for ZIOP/Intrexon’s AdRTS IL-12 in unresectable Stage III/IV melanoma is expected around YE13.
The news gave the price a real boost, soaring from $3.99 (previous day closing) to reach the $4.95 point, but a profit taking by day traders bring the price back a bit and closing up 17.5% at $4.65.
Daily chart
During the spike, the price had two important resistance lines to deal with, first $4.81 the upper line of the channel, then the 200-day Moving Average around $4.93, despite the huge volume that day (10 times the average volume), the price failed to breakout those two resistance lines and close above them and closed at $4.65.
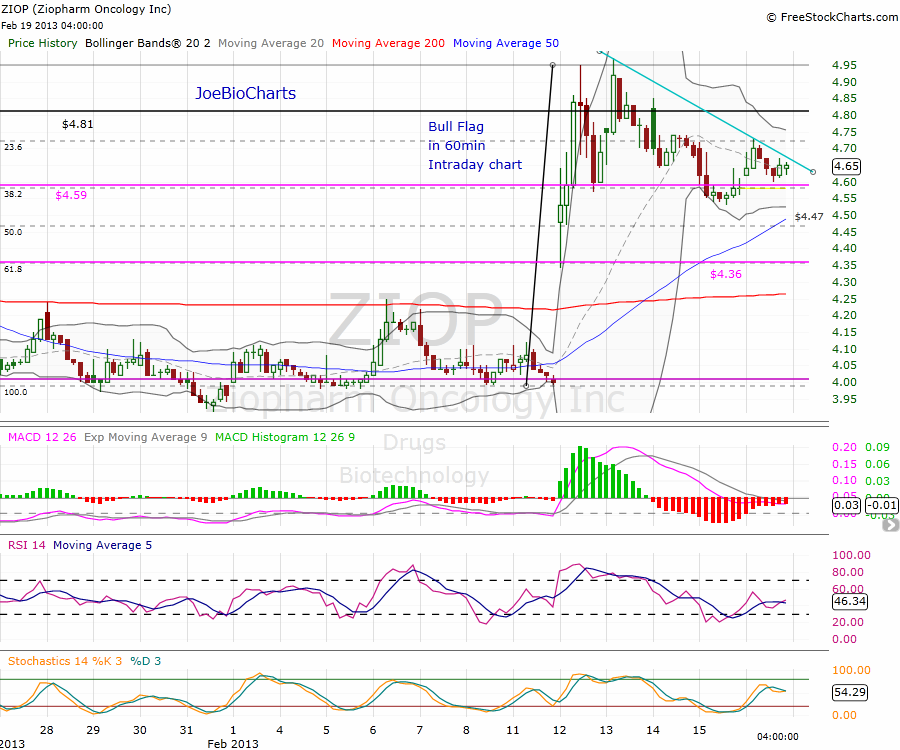
To get a clear picture of the price action and the technical correction after the first spike, let us get a deeper look at the intraday chart 60min to find the resistance points and the levels of the technical correction as well.
Intraday chart 60min
In the intraday chart we can see the weekly line $4.59 used as a support line on the first technical correction along with the Fibonacci 38.2% line, the price bounce up to reach a higher high $4.97 but again failed to stay above the 200MA and drop again towards the support line, reaching the lower point of $4.53.
Most technicians will look for the gap to be filled, or at least a full technical correction to the Fibonacci 61.8% line around $4.36, but for ZIOP, the near term catalyst is more important than the technicals, that will bring a lot of interest around the name and more traders will try to get more shares on any dip. We see the volume decreasing during the technical correction, and forming a “Bullish Flag Pattern”, in case of breaking out the downtrend line (Light blue on the chart) on increasing volume, then we will see the price breaking out the 200-day moving average and the last high of $4.97. The first target is the $5.25 resistance line followed by the weekly line at $5.64, we can see the price reaching the last high of $6.02 ahead of the data, while a significant positive data may lift the price towards the $7 mark.
Disclosure: Author Long ZIOP


