
Merck & Co. Inc. (MRK) -NYSE
Lately, Merck was under the spot light after Idenix Pharmaceuticals deal, paying $3.85 Billion more than triple Idenix’s market capitalization before the deal , and to take part of the Hepatitis C battle, one of the hottest areas of drug development along with GILD, ABBV and BMY. But the spot light will shift during the 4Q-2014 to the Anti-Pd-1 antibody MK-3475 so called Pembrolizumab, starting at ESMO 2014 Congress, which will take place in Madrid, Spain – 26 Sep – 30 Sep 2014. Investors are looking for updated data, while the focus will be on any combination data as well as the company’s ability to file with current lung data, followed with the PDUFA date on October 28, 2014 for approval in post ipi melanoma patients. Then back to Hepatitis C on November at AASLD with early swift data, proof of concept combo to see if RX duration can be lowered to 4 to 6 weeks with Sovaldi, Merck might use Idenix nuc for this combo. So it is going to be a busy quarter for Merck and the investors.
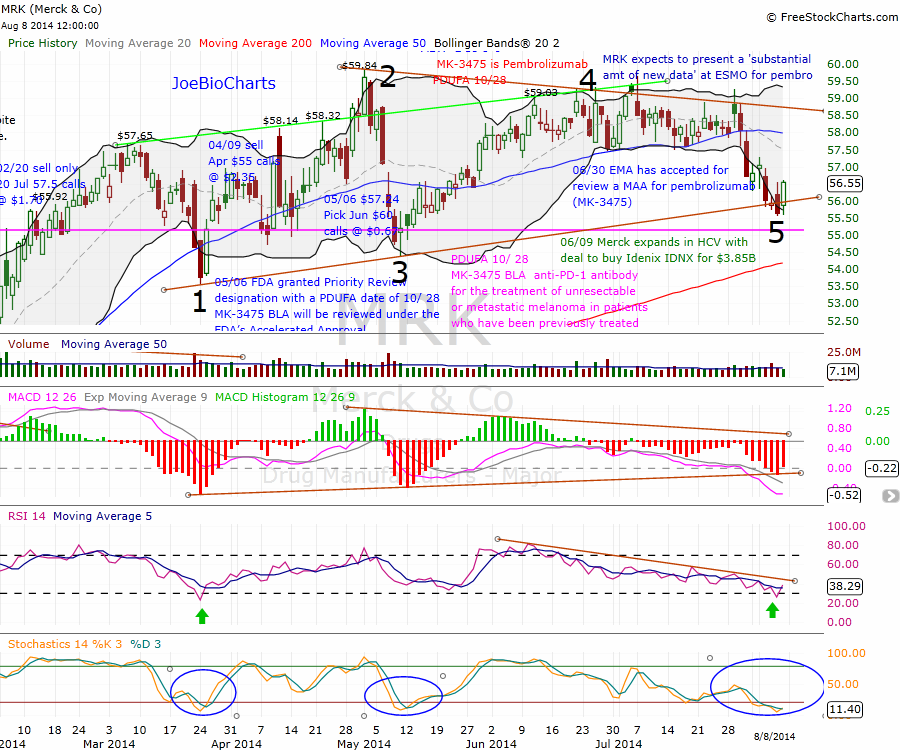
Since late March 2014 Merck start trading side-way forming a symmetrical triangle printing a lower highs and higher lows, this form of consolidation known as a continuation pattern, while roughly 75% of symmetrical triangles are continuation patterns and the rest are reversals. The reversal patterns can be especially difficult to analyze and often have false breakouts.
Daily Chart
Click on the chart then zoom in to enlarge and get larger and clear picture.
Merck is trading within a huge symmetrical triangle for more than 4 months, the price still below the 50-Day moving average, but above the long term 200-Day moving average, this price consolidation creating more pressure within the Bollinger Bands and within the triangle. In the past 8 trading days the price dropped along with the biotechnology sector IBB, to find support at the lower line of the triangle. Meanwhile, the indicators including the RSI and Stochastics, are in the Over-Sold territories, and it is easy to check back the price action when the Stochastics dropped below the 20 line highlighted with the tree blue circles, moreover, the RSI turn upward after a short visit in the Over-Sold territories forming a V shape, the same as it did in late March. It’s hard to get the final indication from a short period of change and need a few days of continuation and uptrend to see the RSI rising above the downtrend line as you can see on the chart, and a calm period at the biotech sector and broad market as well.
What’s Next
Is it the time to pick Merck ? (if you are not in already) . At this point and after the Bullish Engulfing Pattern formed on Friday, it is easy to start building a position around $56 with smaller risk as it is easy to set a tight stop loss in case the price is back to the downtrend, the stop loss can be set a few points below the lower point reached on Thursday $55.57 for the conservative trader, or a few point below the weekly support line (horizontal pink line) at $55.14 for the risky traders that love challenges. Solid investors who are not willing to take risk, might wait till the 50-Day moving average breakout or the triangle’s upper line around $58.50, but they will miss few points, especially with company like Merck which have a busy quarter coming up, full of updates and catalysts.
One more way to trade Merck is through January options, well behind the catalysts that are coming through the 4th quarter, with $57.50 or $60 call options, or with lotto $62.50 call option that will be sold way before the expiry day, just after any positive news and price spike.
Disclosure: The Author Long Jan’15 Calls.


