
TG Therapeutics has two programs, the CD20 targeting antibody TG-1101, and PI3K delta inhibitor TGR-1202. The focus of this post is on TGR-1202. Earlier coverage can be found here [link].
TG has been hesitant in giving out the structure of TGR-1202. It’s out now, so here it is below along with Idelalisib and IPI-145 (left to right) for comparison.
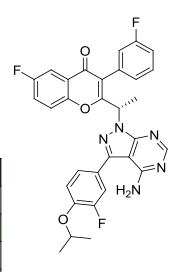
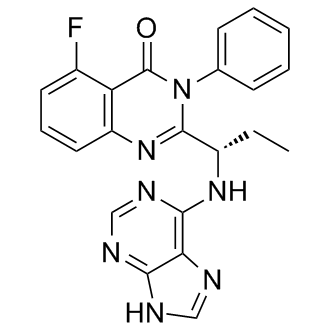
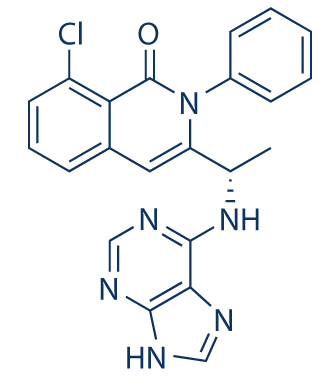
IPI-145 is nearly identical to Idelalisib while the TG compound has a few additional modifications, likely accounting for its different behavior. Differences in PK have been commented on previously, so they won’t be covered much here.
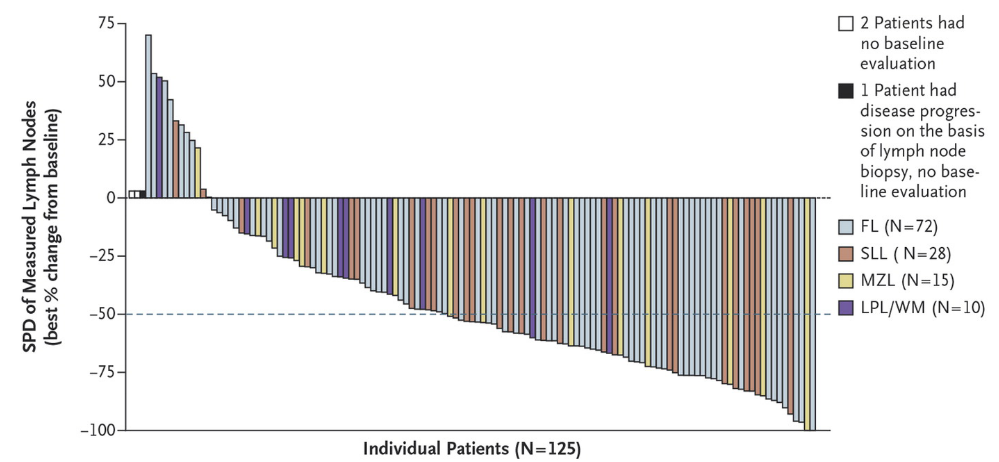
Seeing data being presented on TGR-1202 has been like watching a slow-motion video of Idelalisib or IPI-145 in action. One and a half years after trial initiation and following dose escalation to greater than 800 mg QD, it appears TGR-1202 is showing definitive activity in CLL through what TG calls a “Delta-like” manner.
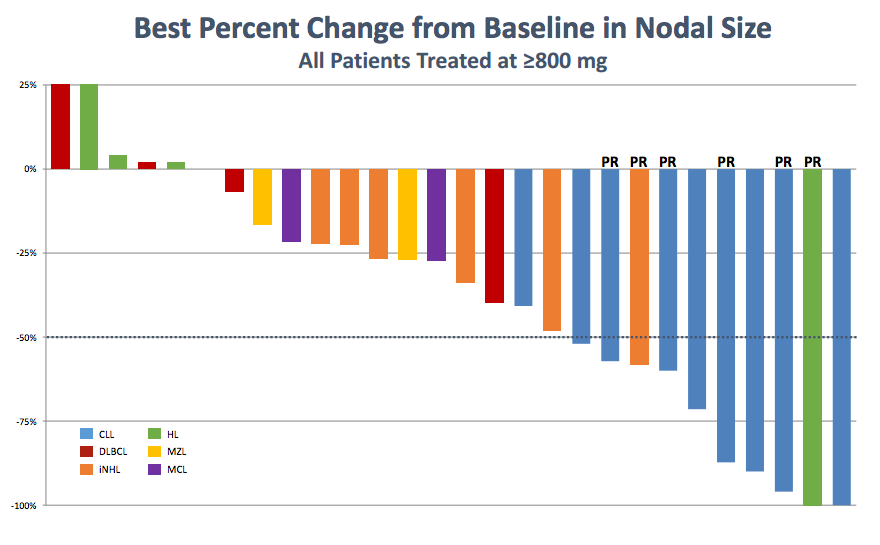
Notice that while responses in CLL are now apparent, TGR-1202 oddly fails to demonstrate substantial activity in iNHL (orange bars) and MCL (purple bars)- both of which are known to be susceptible to PI3k delta inhibition.
Below are waterfall charts from Idelalisib in iNHL:
And MCL:
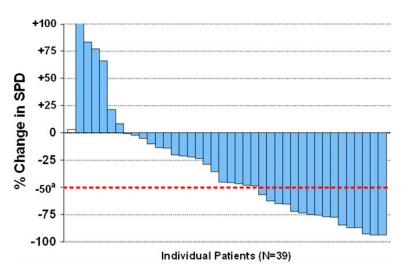
Data are similar with IPI-145.
In a company presentation, TG attempts to explain the lower than expected activity. Previous high doses are now considered the the “bottom end of range for projected clinical efficacy.”
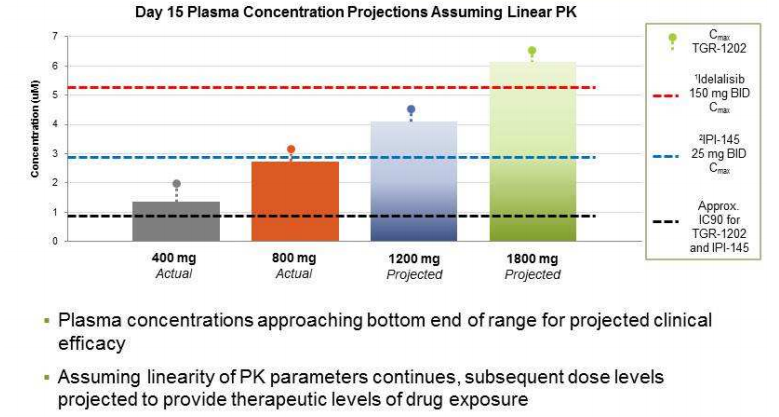
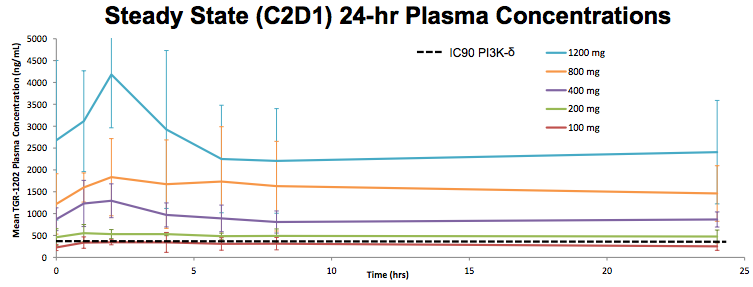
But this chart is a complete fraud. Based on my calculations (assuming a MW of 500 for TRG-1202), TG is comparing the Cmax of Idelalisib and IPI-145 to what appears to be the Ctrough of TGR-1202.
Disclosure: Author is Long GILD


