
Adamas Pharmaceuticals, Inc. (ADMS) –Nasdaq
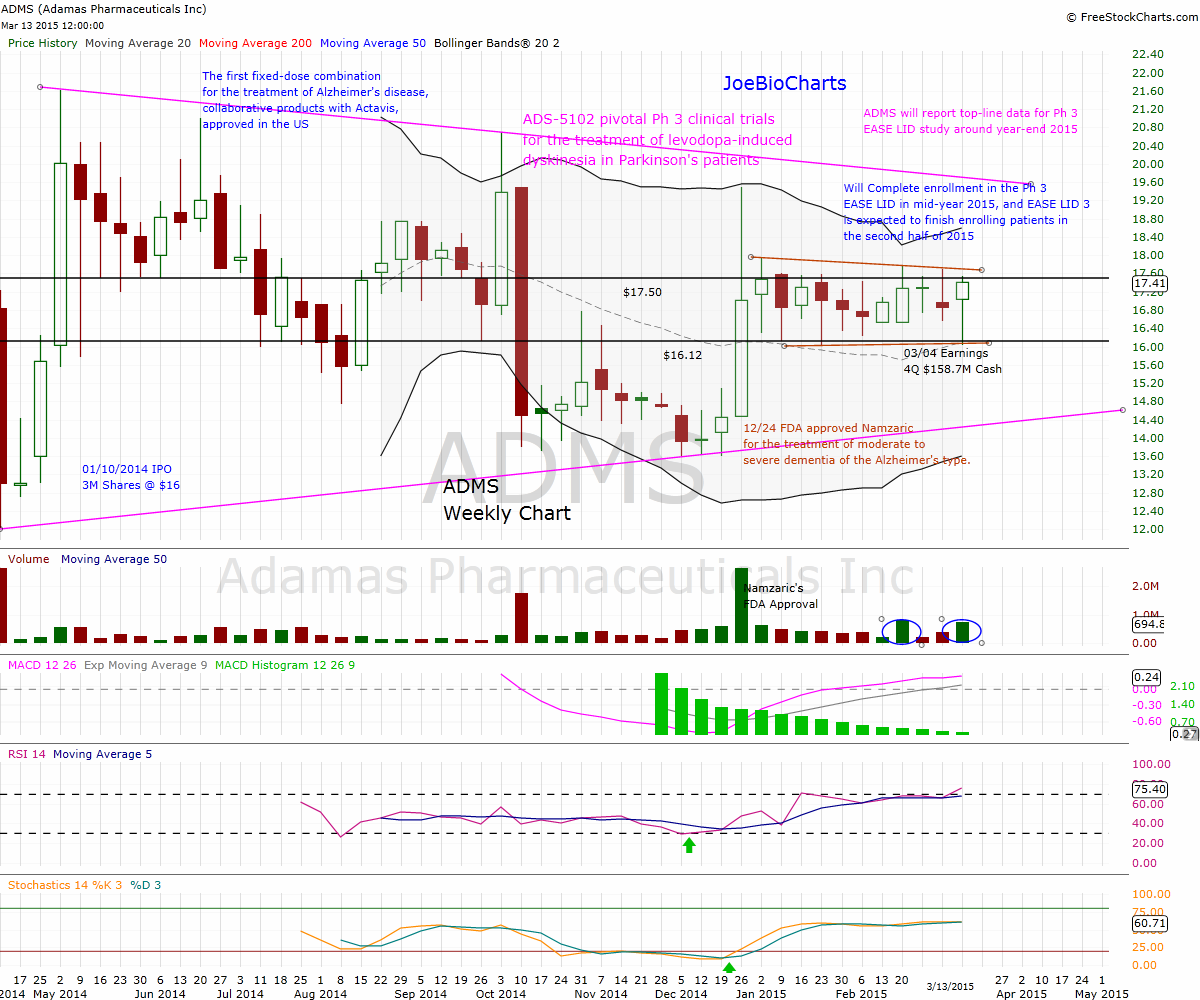
Adamas pharmaceutical had its initial public offering last year April 10th, the closing of its IPO of 3 million shares at a public offering price of $16.00 per share. The shares began trading on The NASDAQ Global Market under the ticker symbol “ADMS” on April 10, 2014. Adamas had net proceeds from the offering around $41.5 million after deducting underwriting discounts and commissions and estimated offering expenses.
ADMS focused on CNS diseases, specifically Parkinson’s and Alzheimer’s Diseases. With notable low market cap ~$300M and high on cash with$158M as YE2014, low float with most of the shares (64.2%) held by insiders and institutions (link)
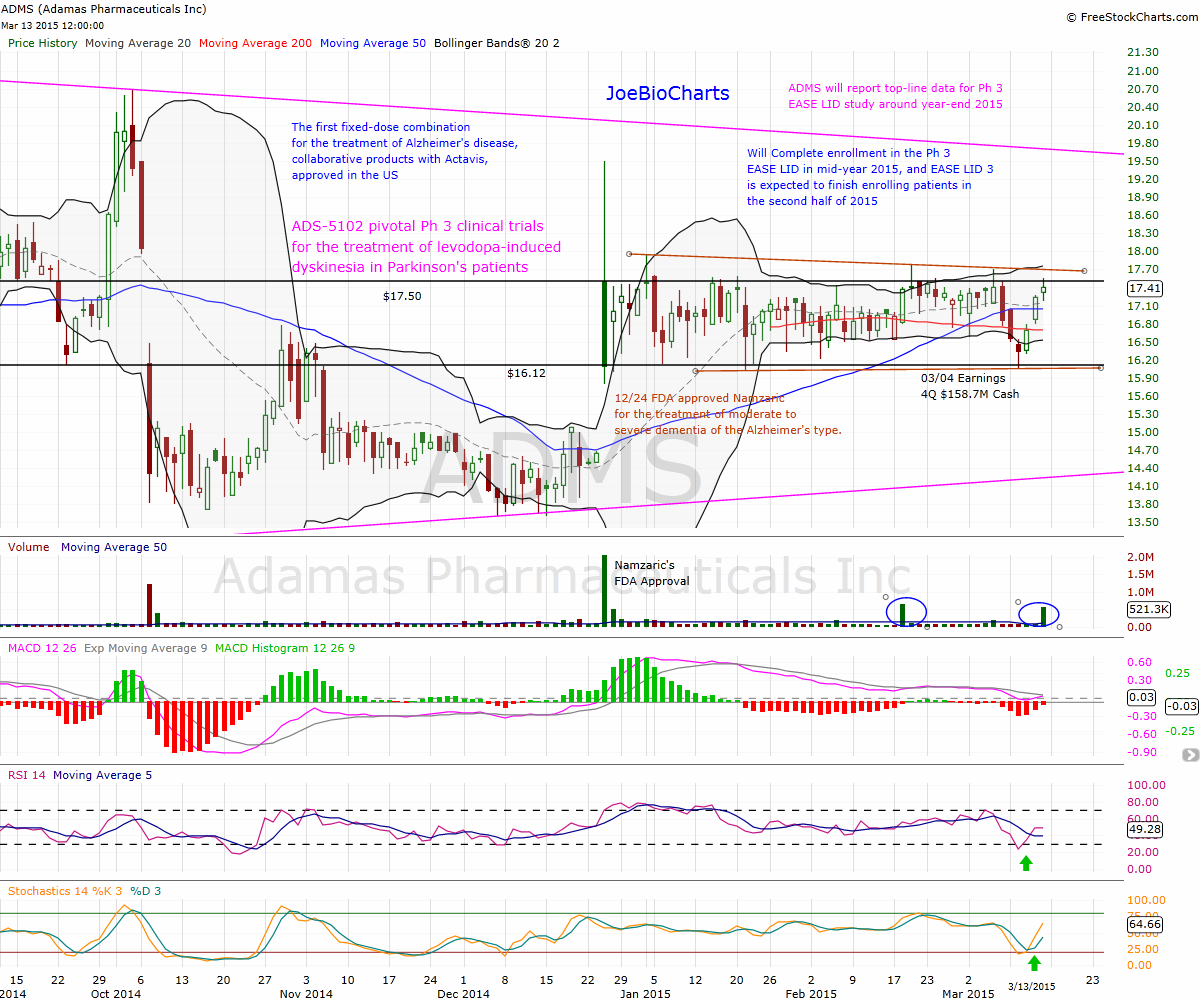
Since Dec 24th, 2014 the Namzaric’s FDA approval for the treatment of moderate to severe dementia of the Alzheimer’s type, ans has received a $30 million milestone payment from its partner Actavis. ADMS start trading within a predefined horizontal channel, between the support lines $16.12 to the upper resistance line $17.50, while the Bollinger Bands are getting tighter and closer to each other. This creates a Volatility Squeeze condition within the bands, combined with decreasing volume showing a consolidation mode. This side-way movement can last potentially for a few days or weeks, usually followed by a volatile move and breakout of the upper or lower Bollinger Band, creating a fast and long move. Last Friday we noticed a very large volume of 521K shares compared to a daily average volume of 87K shares, with a one minutes strange price action where 363K shares changed hands between $17.23 to $17.29.
Daily Chart
What’s Next
ADMS is an under the radar company with Alzheimer’s asset and trading only 2X of its cash, would be a good time to start a position as we get closer to the volatility squeeze action, the price have to breakout the channel’s upper line $17.50 on large volume and close above the line, that would trigger the upper Bollinger Band to start opening upward as well and bring a volatile price action. Traders can wait for the $17.50 line breakout to start a position with a stop loss bellow the previous trading day, while the risk lover traders can start a position within the channel with a stop loss just few points below the channel’s lower line $16.12.
Breakout of the channel’s upper line will bring us a move of at least the channels depth ($1.38) and calculated the price target at $18.88. But taking a quick look at the weekly chart we can see a large triangle where the upper line target around $19.60, that would be the first strong resistance line, and would be tested and maybe breaking out in case of a positive news like Namzaric’s European partner or US launch which expected during the 1H2015. Moreover, ADMS expected to report top-line data for Ph 3 EASE LID study around year-end 2015
Weekly Chart
Disclosure: Author Long ADMS


