
I am introducing a new series of reports that take a data analytic look at the sector. These use data I collected and coded about various aspects of the sector. If you would like additional information about these data or additional data analysis that can be performed, please contact me at (dsobek@sobekanalytics.com).
We know that M&A and in-licensing are an important part of the sector as it not only replenishes the pipeline of larger companies, but it also provides capital for early-stage companies and startups. I want to look at the performance of 2016 oncology in-licensing deals. Why 2016? This provides a significant amount of post-deal time to get a sense as to how the assets developed and this is important as the vast majority of the deals (19 of the 23 done in 2016) were either discovery (8), preclinical (7), or a combination of discovery and preclinical (4). Given how early these deals generally have been, it is going to take time for them to enter the clinic and then develop a clear clinical profile.
The group of assets from 2016 were IO heavy (15 of the 23 licensed assets). TKIs were the next most popular with 5 deals followed chemo/ADC with 2. While targeted protein degradation (TPD) has become more popular since 2016, it was still nascent at this time and only one involved a TPD asset. There was a wide range of targets with only pan-kinase having multiple deals (please contact me for a full list of the targets in these deals). While one might expect more clarity on the targets, given that many of these were discovery and have not produced a late-stage asset, we still do not have data on many of these deals and so the distribution of targets could change over time.
There was more diversity in terms of modality. The most common were antibodies with 8 of the deals followed by drug conjugates and small molecules at 4 each. In addition, 3 of the deals were bispecifics and another 2 were oncolytic viruses. CART, TCR, and TPD rounded it out with 1 each (and this does add up to more than the number of deals as some deals were multiple assets and modalities).
How have the assets in these deals fared? Of the 23 deals, only 3 led to an approved product and all of those were deals that involved a phase III asset or one that was already approved (and so the approval in that case was an expanded indication). Of the 19 deals that were preclinical or discovery (there were no deals for a phase II asset), there have been no approved drugs. There are two deals that have led to a phase II trial and another 9 that developed a drug to enter a phase I clinical trial. This leaves 9 of the 19 discovery/preclinical deals having not produced a drug to that entered a clinical trial.
Does the fact that 9 of these early-stage deals have not produced a clinical asset represent a failure to evaluate or simply the risks associated with early-stage deals? Obviously, part of outcome relates to the risks and some of these deals might still produce a clinical stage asset but there is still some rationality to the strategics when they entered into early-stage deals. The following figures examines the relationship between upfront payments and success.
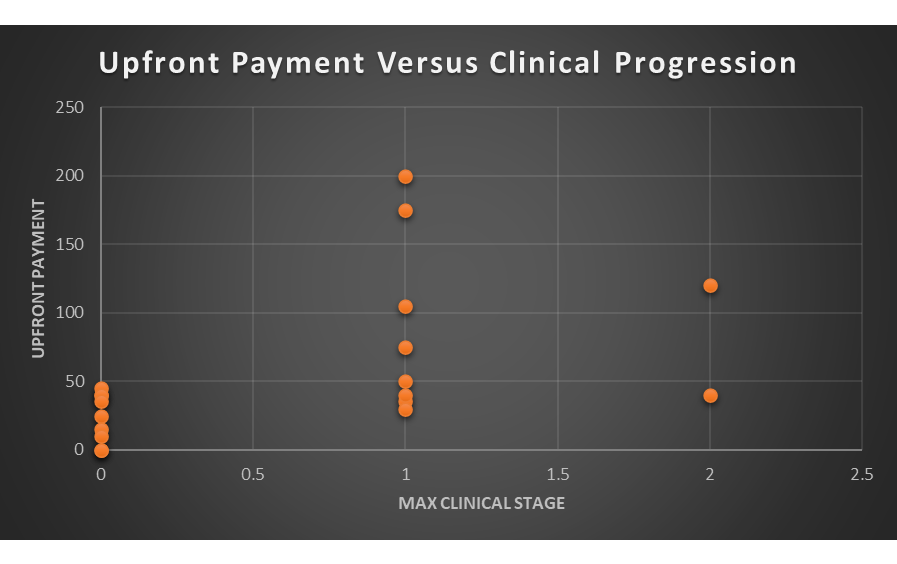
Why look at upfront payments? This represents the guaranteed costs associated with the deal. All other costs are variable as it depends on ongoing research and milestones. If companies view a particular deal as risky, then it makes sense to defer the costs of the deal to a later point where more information has been revealed in the research process. What does the data show?
I do not think a lot can be gleaned by the two deals that produced a phase II asset as the numbers are too small to draw a conclusion. If we compare, however, the difference between the deals generating a phase I asset and those that did not produce a clinical stage asset, it appears that upfront payments are sending a real signal. It might not be the most surprising outcome, but it appears that deals that led to a clinical stage asset had higher upfront payments.
I do not want to create a false sense of specificity from these data but no deal with an upfront payment above $45M failed to produce a clinical stage asset. In comparison, no deal with an upfront payment below $30M generated a clinical stage asset. There seems to be a muddled middle between $30M and $45M where results are more varied. While I would not use those cutoffs as hard and fast, there does seem to be some selectivity going on with upfronts as the strategics differentiate the likely riskier deals with lower upfront payments.
Of course, there are multiple other ways to examine the data in terms of targets, modality, and therapeutic indications. In addition, this is a single year of data and while these have had the most time to produce approved products and clinical stage assets, an analysis of 2017 or a later year might see more success (or less).
As I noted at the start, this is just one cut at the data and additional analysis could be done or years added (or look at neurology or other therapeutic areas). If you have any questions, please feel free to contact me.


