Exelixis (NASDAQ: EXEL)
On 5/30/12, Exelixis submitted their NDA for Cabozantinib as a treatment for patients with progressive, unresectable, locally advanced, or metastatic medullary thyroid cancer (MTC). They were subsequently granted priority review with a PDUFA date set for 11/29/12. Recently, the FDA announced they had planned to hold an Advisory Committee to discuss this NDA. However, on 8/29/12, Exelixis notified investors that this panel was cancelled.
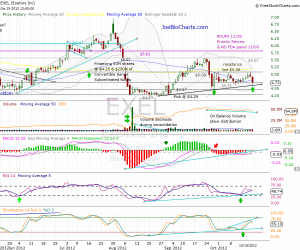
During this period, the price of $EXEL spiked hard reaching the high of $6.95 on 07/30, followed by strange price action with 4 red days in a row. This was ahead of the biggest financing by $EXEL where they sold 30M shares @ $4.25 & $250M of Convertible Senior Subordinated Notes, the price dropped hard reaching the low of $4.27 with a huge volume, as over 70 Million shares traded in the PM (Pre-Market trading) & the open market. This huge volume had created a strong base and support around the $4.29 point.
In my last TA report, titled “EXEL – In A Consolidation Mode” on Aug 28th, we started a position ahead of the new uptrend around $4.29 just at the right time, as the consolidation brought a volatility squeeze & breakout of the sideway trading, starting a fast & steady uptrend reaching the high of $5.56 just a penny from the gap filling @ $5.57.
Daily Chart
As the price reached the $5 area, we saw some pullback as the financiers of the offering, started taking profits & shorting the stock, so they can use these profits to pay for the convertible. The price found support @ the horizontal line $4.47, bouncing back & trading sideways.
Looking at the daily chart, we can see the uptrend line (black line) as a support to the price — this Friday the price dropped down along with the markets & the biotech sector, but found the support line waiting there and bounced back & closed above the $4.70 line.
What’s Next
If the uptrend line fails to keep as a support line this Monday (October 22) & it breaks down, this will create a new downtrend in the short term, bringing the price again to the $4.29 support line area. But looking at the indicators, we can see that the Stochastics, RSI & the MACD are in a Bullish Divergence, showing the positive momentum despite the red days, the only red flag I found is the OBV (On Balance Volume) which keeps trending down showing a distribution of the stock instead of accumulation, so we need to get a confirmation in the coming few days.
In the biotech sector, along with technical analysis (including indicators & momentum), I’m focusing primarily on the fundamental side, as the catalyst is mostly driving the price action. Moreover $EXEL is getting very close to the PDUFA date (just 5 weeks till the decision day on 11/29/2012) so I think that more interest is coming & more catalyst traders will start taking positions in this name bringing a boost to the price & creating a new uptrend.
The first resistance line is the $5.08 line that acted as a resistance line several times, followed by the gap filling line @ $5.57, while the weekly resistance line @ $5.81 is the strongest one in case we have a breakout ahead of the PDUFA date, so we might see a testing of the last high at $6.95 again.
Disclosure: The author is Long $EXEL


