
Delcath Systems, Inc. (DCTH) -Nasdaq
DCTH has been on our watch list for a while, looking for an entry point. we kept following out the stock performance at the forum and stated a position at $1.63 just after the price found a support around the 200-day Moving Average, also added more shares to the position at $1.69 as we sent via the private feed to the CRG subscribers.
From the fundamental side, Juan did a great review in his last report Our take on Delcath’s upcoming advisory committee; despite this bearish view we still think DCTH will keep the uptrend as more traders jump in, to follow this name ahead of the advisory panel. As we get used with most of the similar biotech companies that run up during the same period, we think DCTH mostly will do the same.
Daily Chart
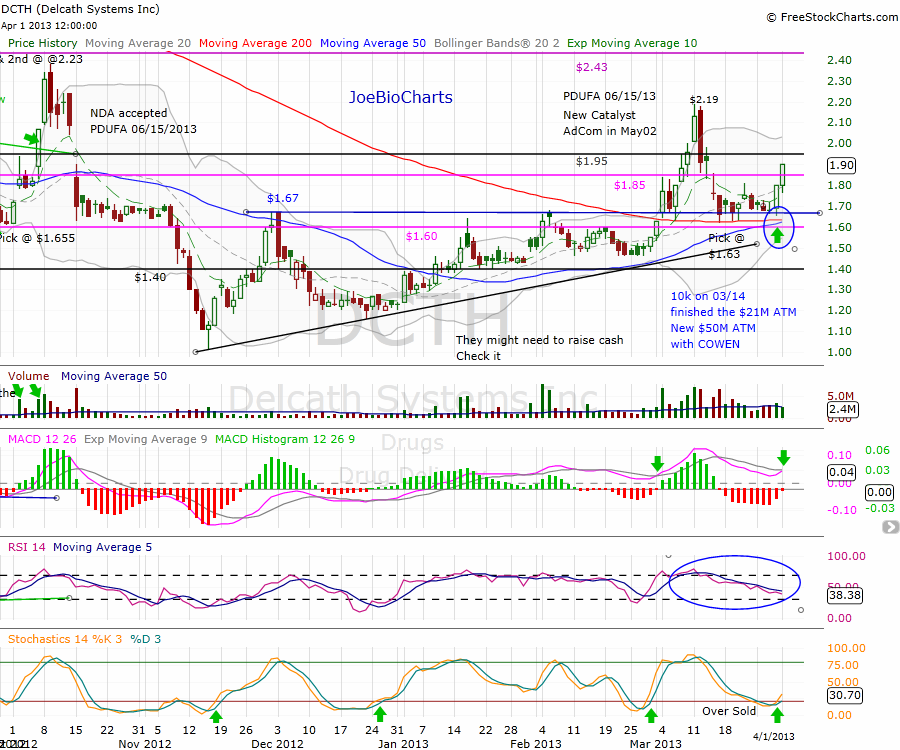
Since November 15, 2012 the price was trading within an uptrend triangle, where $1.67 was the upper resistance line, until we got the breakout and the price soared hard to reach the high of $2.19; but as with every uptrend, a technical correction started bringing the price back towards the $1.67 line, touching the 200-day moving average three times around $1.63 and bouncing back above the upper line of the triangle.
While we are keeping our eyes on the 200-day moving average, the 50-day moving average keeps creeping up and heading to a very important event in the technical analysis called ” The Golden Cross” which is considered to have bullish implications. This is when a short term moving average, the simple 50-day MA, crosses from below to rise higher than the long term moving average, the simple 200 MA. The Golden Cross indicates a bull action on the horizon and is reinforced by high trading volumes. Additionally, the long-term moving average becomes the new support level in the new uptrend.
What’s next
Yesterday the price broke out from the weekly resistance line $1.85 and closed above it, while the Stochastics started moving out from the over sold zone. By looking at the chart, we can see the four green arrows showing the behavior of the price along with the stochastics, as the price popped up when the stochastics started moving up from the over sold zone and kept the uptrend.
The RSI is the only red flag keeping the down trend while the price heads up. On the contrary, the MACD is very close to the cross over, the same as we had ahead of the last run towards the $2.19 high.
The next resistance line is the $1.95 followed by the $2.19 – the last high, and in case of breaking out, the next target will be the weekly resistance line $2.43 which we might see breaking out in the case of a positive notes and advisory committee vote.
Disclosure: Author long DCTH


