
Onconova Therapeutics, Inc. (ONTX) -Nasdaq
Onconova has recently plunged about $19 from the 52-week high at $31.13, reached just a month ago to the current level in mid-$13s and reaching the low of $12.03 today. Surprising given the Phase 3 readout coming up and final results from the Phase-II trial of oral rigosertib in 1st-line Low-Risk MDS at ASH-2013.
As David mention in his November 11- EOD report “There is a chance that the full data set at ASH will help but everyone and their mother is negative on ONTX and it might be hard for phase II data to change it“.
Let us take a look at the daily chart and try to find the main technical points.
Daily Chart
Click on the chart to enlarge
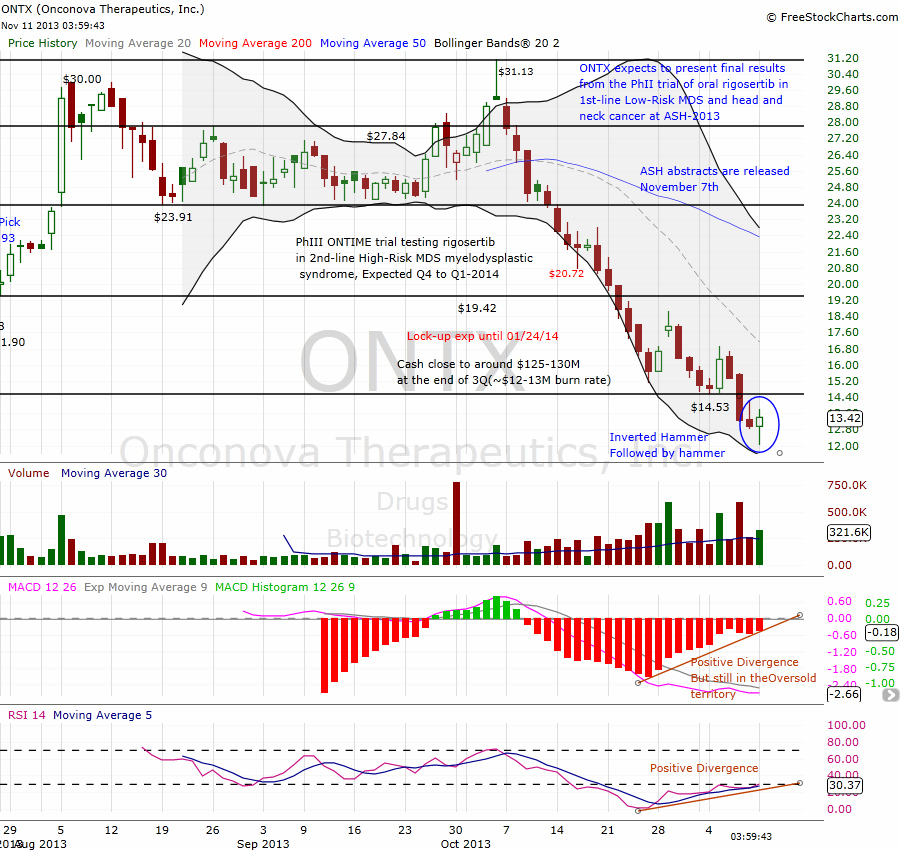
The price had a 20 red trading days against 6 green during the last 26 trading days, dropping it below the IPO price($15). This is where so many traders got caught in this trade, trying to buy the dip and bottom fishing.
Friday’s close with an inverted hammer candlestick gave us the hope that there is a possibility of a trend reversal. This was followed by the Monday’s devastating open, dropping below Friday’s lower point of $12.80, triggering stop losses and printing a new 52 weeks low at $12.03. But the price started recovering during the trading day and closed up 3.24% forming another bullish “Hammer” candlestick.
Looking at the daily chart, we can see the indicators pointing upwards, while the RSI (the lower indicator on the chart) started moving up, to leave the oversold territory. We can see a clear “Positive Divergence” where the price move down & creating a lower low, but the RSI and the MACD Histogram creating a higher low, in this case, we get the feeling that the selling pressure is out of steam, and the bulls start taking control over the bears, at this point it’s safer to start a position, as the Risk/Rewards is in our favor, it’s easy to define the stop loss very close just few points blow today’s lower point, while the price target is much higher. But we have to keep watching the price action closely, as the negative sentiment during the last two weeks in the biotech sector and especially in ONTX. If the price tomorrow didn’t form a higher high (>$13.81) and we get a reversal trend continuation, then it’s time to consider closing the trade or to stay with a tight stop loss.
Disclosure: Author Long $ONTX


>it’s easy to define the stop loss very close just few points blow today’s lower point,
Can you be more precise with the stop loss? tia
Dore