iShares Nasdaq Biotechnology (IBB) -Nasdaq
The best indicator for our biotech portfolios are biotechnology indices such as IBB, NBI, XBI or XLV. By looking at the IBB daily chart, we get the whole picture of the latest epic run in the biotech sector during 2013, with a whopping run from 134.21 to 227.06 points, gaining 69.2%, while keeping the positive momentum through today. Positive momentum is what we investors or traders have experienced in the past 12 trading days, adding another 11.1% gain YTD. The index printed a new All-Times-High at 252.18 points, but closed a bit lower, creating a Bearish Doji candlestick called “The Hanging Man” which forms at the end of an uptrend. It is created when there is a significant sell-off during the trading day but the bulls are able to push the index back up so it closes at or near the opening price. Generally, the large sell-off is seen as an early indication that the bulls are losing control to the bears or demand for biotech stocks is waning.
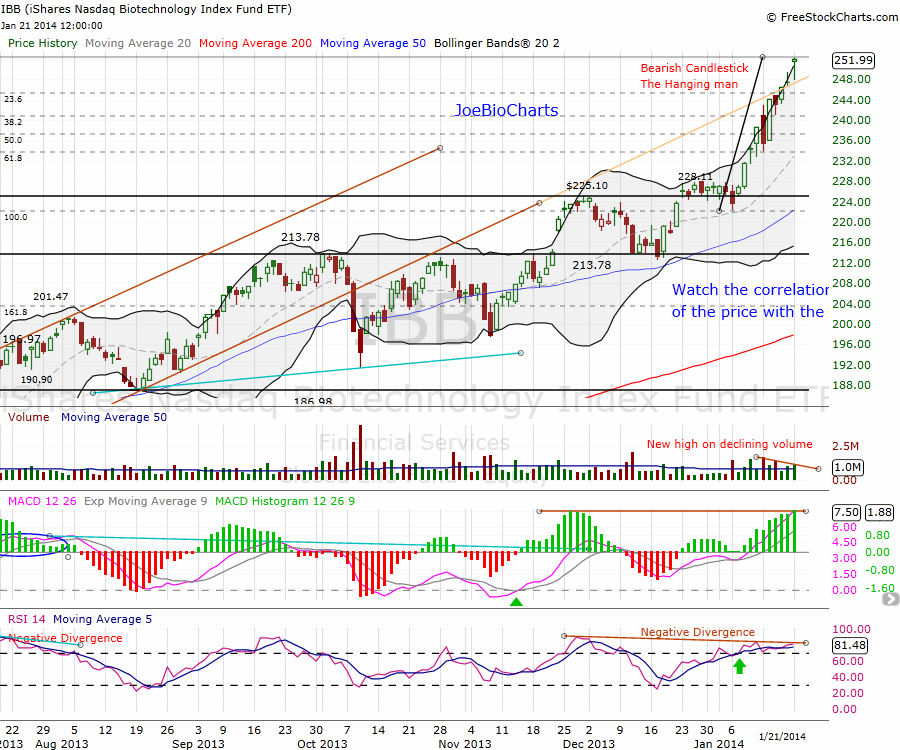
We are starting to feel caution in the air and several signs of weakness can be seen. The first sign of weakness that we can see on the chart is the price printing a new high while the RSI (relative Strength Index), which is already moving into the over-bought zone and is showing a “Negative Divergence”, while the IBB price is printing new highs, but the RSI does not make a higher high. Second, the same can be seen with the Stochastics printing a very high 97.16 in the over-bought zone and preparing for moving down. Third, the IBB price had a good correlation with the 50MA, coming back to retest the 50-Day moving average after each run up. But since Jan 01′ 2014 the price is far away from the moving average as you can see in the chart, and might work as a magnet during any technical correction.
Despite all the signs of weakness around, I continue to like the saying “The Trend Is Your Best Friend, Let the winning horse keep running”. I’m not calling for a nasty correction as most bears are looking for; it is not the time to close all our positions yet. Many traders who were calling for the Double-Top at the end of the year in 2012 around 148.54 points missed a great year, if not the best year in the last decade. The IBB is very strong but needs some consolidation or even a correction. I’m expecting a healthy technical correction to the Fibonacci Retracement Levels, between 38.2% to 61.8% of the last uptrend from the 222.29 points to today’s high 252.18 to reach the 20-Day moving average at least. And a fresh start for the indicators too, by leaving the over-bought zone and getting a reset to start a new uptrend. I will be waiting for any correction to add more equities to my already open positions, or start a new position on any dip.
Daily Chart