
iShares Nasdaq Biotechnology (IBB) – Nasdaq
The best indicators for our biotech portfolios are the biotechnology indices IBB, NBI, XBI or XLV. We will maintain our focus on the IBB as the biotech barometer. And as mentioned in my last report ” IBB – Biotech Sector in The Despondency Point ” the emotions are playing an important role in the investors decisions.
As mentioned several times on twitter following up my theory of being close or within the despondency stage as stated on the “Market Emotions Cycle Chart” and getting so many hate response from traders that was short the markets trying to convince me that the IBB will keep dropping further and it is only a correction and bulls trap.
Joe: The price action in the $IBB today show the willing of the Bulls to buy any weakens & take control from Bears pic.twitter.com/XecOfAmNDG
— Joe (@GantosJ) May 5, 2014
Even in the desperation days, kept my optimism and knew that the more desperate tweets the more conviction we are very close to the bottom. The history show us the max financial opportunity is the time that everyone around want just to sell and traders declaring “I’m all cash” and “Market setting up for a big crash this month. I wouldn’t LONG anything. Short the pop is the play”.
Despite the negativity & despondency all around in the bio sector $IBB looks like finding a new base around 213.78 line..Then bounce time !! — Joe (@GantosJ) April 15, 2014
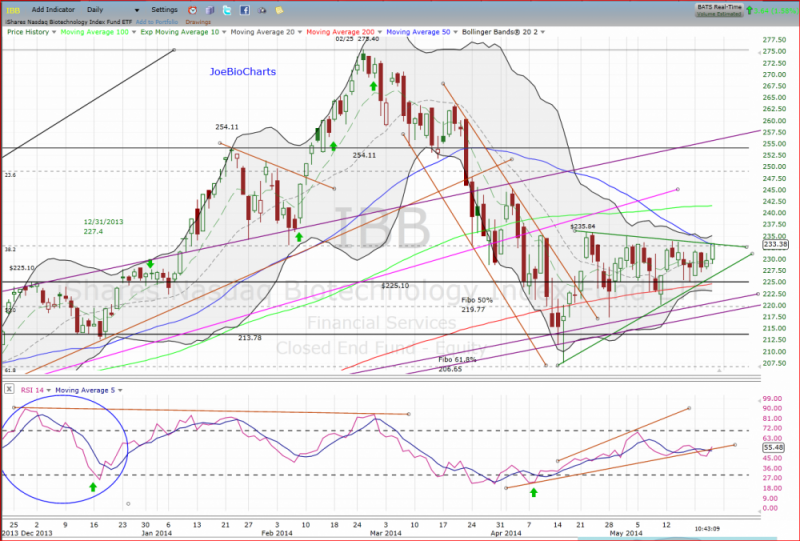
The IBB start trading side-way forming a symmetrical triangle printing a lower highs and higher lows, this form of consolidation known as a continuation pattern, while roughly 75% of symmetrical triangles are continuation patterns and the rest are reversals. The reversal patterns can be especially difficult to analyze and often have false breakouts.
Daily Chart
Click to enlarge
The IBB trading within the triangle for 5 weeks, below the 50-Day moving average and above the long term 200-Day moving average, this price consolidation creating more pressure within the Bollinger Bands. In the last 15 trading days, we can see clearly at the chart several doji’s a “small candlesticks” and trading side way, while the Bollinger Bands are getting tighter and closer to each other. This creates a Volatility Squeeze condition within the bands, combined with decreasing volume showing a consolidation mode. This side-way movement can last potentially for a few days or weeks, usually followed by a volatile move and breakout of the upper or lower Bollinger Band, creating a fast and long move. but if we combine the volatility squeeze with the symmetrical triangle we would like to get a breakout of the 50-Day moving average and the triangle’s upper line with expanding volume. The volume should be larger than the previous days to ensure the breakout, but in case of a light volume, we might get a “fake break” and the price would drop back at least to retest the upper line again, or even further down towards the lower line of the triangle. Trading back side-way within the bollinger bands and extending the horizontal channel.
In case of a real breakout, the volatility squeeze will bring us a fast and long move upward, that would be triggered by traders and investors chasing the price and trying to jump back in the train so they won’t be left back alone on the station.
In the down side case, the points that we should watch are the lower line of the triangle and the 200-Day moving average, breaking those lines down on expanding volume would trigger a continuation of the downtrend.
Disclosure: The Author Long biotech stocks.


Joe – This is for my information, but other than today’s price action as an indicator why would you say it is a continuation upward as opposed to downward? It looks like the triangle begins at the low of 207.48 and the channel before that was downward. If this is a continuation triangle, wouldn’t it be in the downward direction, or am I missing something? Is it upward continuation because of the MACD upward momentum you displayed? Is it because the support leg of the triangle is steeper?
If you read again, you will find “this form of consolidation known as a continuation pattern, while roughly 75% of symmetrical triangles are continuation patterns and the rest are reversals” ….most of the symmetrical triangle goes with the trend.. I’m calling it the “Decision Zone” while the indicators want more upside, but we cant ignore the downside too… the coming days/weeks are very important … watching the Bollinger Bands & the volatility squeeze in one direction.. up or down!!