
Sarepta Therapeutics, Inc. (SRPT) -Nasdaq
During the past six weeks we had so many stories, with or against SRPT approval, where a 10-million shares short sellers are still traped in this name with a significant loss after the FDA approval, and they are trying nonstop any way or attack to find a way to make this approval looks as insignificant for the company. But they all forgot the significant importance of approving the only drug for DMD boys and young men, who have no other choice in the market these days (and unfortunately not in the near future) other than Sarepta’s Exondys-51 who kept the 10 boys from the early trial walking till these days even at age of 15 years old.
In this report I’m not going to talk agian about the fundamentals as we all heard enough from both sids. but I’m going to look at Sarepta from the technical standpoint, SRPT had a deep correction after the FDA approval on September 19th and shooting up to a new 52 weeks high at $63.73. The technical correction started the day Anthem (ANTM) one of the largest medical insurers in the US, says it won’t cover Exondys-1 and cause to a large drop in the share price, creating a snow ball reaction to bring the share price to the low of $35.33 last Thursday.
The day the share price reach the lowest point since the approval, was also a day that any technical analyst would look closely at the chart, printing a “Bullish Hammer” that used as a reversal pattern signal, but a continuation candle needed. The hammer is a single candlestick patter comes after a bearish sell-off a significant rally, brings price back up creating a long bottom wick. The long lower shadow of the Hammer implies that the market tested to find where support and demand was located. When the market found the area of support, the lows of the day, bulls began to push prices higher, near the opening price. Thus, the bearish advance downward was rejected by the bulls.
Daily Chart
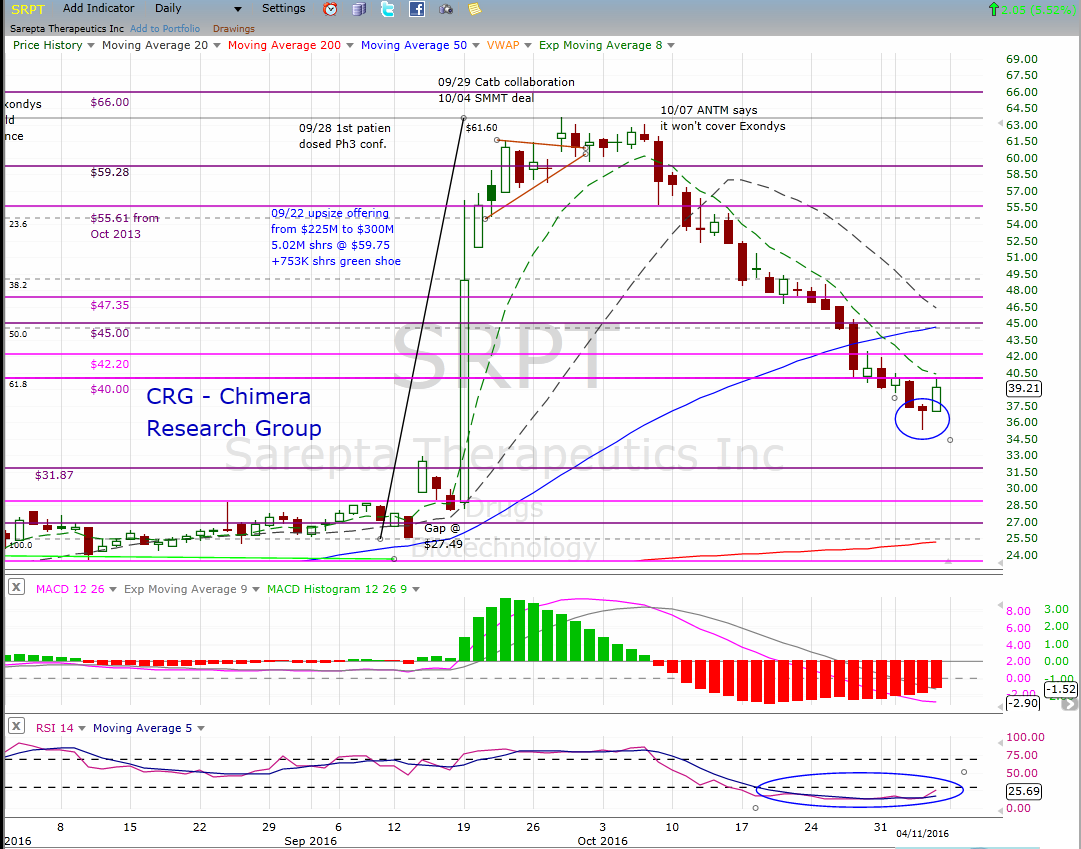
On Friday’s market close, we got the continuation candlestick, giving us a hint that the bulls who stepped in at the bottom are in control and keep buying the shares of SRPT at this point. for the bottom fishing traders, this is the point to step in with lower risk as they can put a tight stop-loss a few point below the latest low, but for the conservative traders or investors, the reversal conformation would be the day we see a breakout of the 50-Day moving average and closing above it.
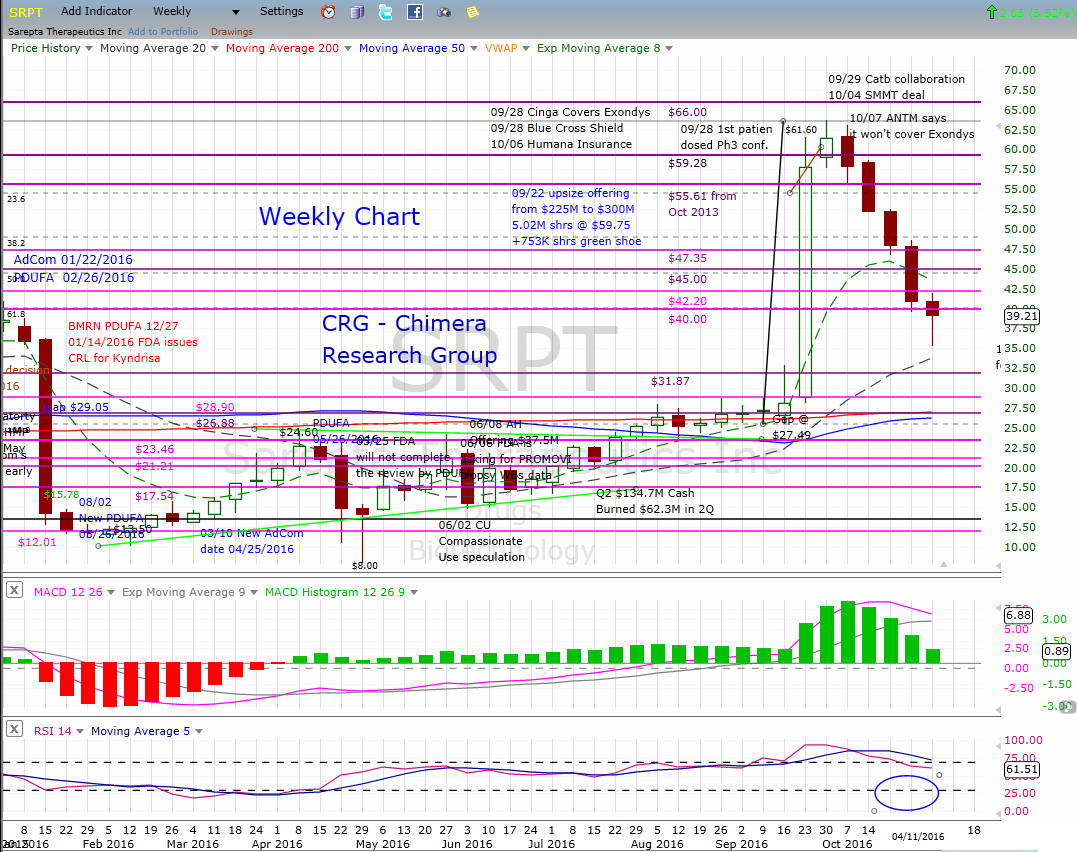
Weekly Chart
what makes the daily chart even more important this week, is the look at the weekly chart, where we got another important “Bullish Hammer” candlestick, but as I mentioned in the daily chart, we need a continuation candlestick, and in this case we are talking about a full trading week & the weekly candle printing later on Friday closing bell.
Disclosur: Author is Long SRPT


