
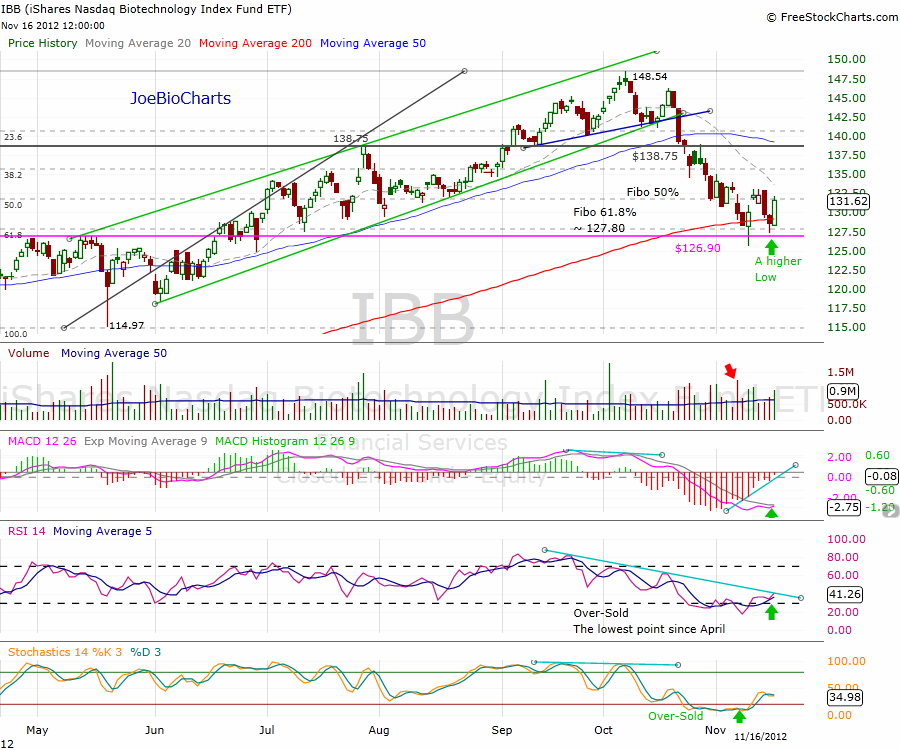
In my previous report “IBB – A Closer Look at the Market’s Direction” I tried to find out if the markets bottomed out after the technical correction in the indices $IBB and $SPX, as both reached a support area, and the price found a support line around the Fibonacci 61.8% .
Is it the bottom ?
The markets reached extreme oversold levels, presently only 24 companies from the biotechnology index with a share price over the 50 and 200 day moving average!! That’s a sign of extreme oversold, and historically this is the level and right time when the markets starts looking for a change.
It is hard to tell right now if the markets have reached the bottom and will turn around, creating a V shape as it had six moths ago, although the signs on the chart give a hint of change. Yet we need more green and strong days, a positive momentum in the indicators, and nothing but some positive news about the Fiscal Cliff solution getting closer, in which case, we can get a new strong uptrend.

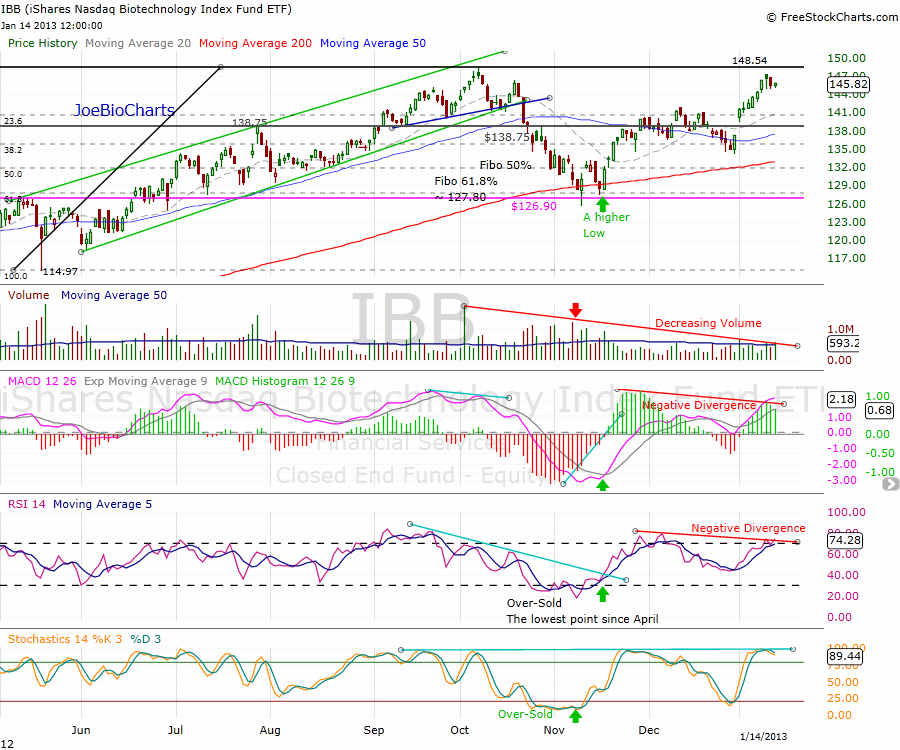
As we know, the markets have moved up as mentioned in my technical analysis and these days the price is very close to the previous high from October 2012. Let us take another look at the daily chart of the index, and try to figure out if the markets are strong enough to create a new 52 weeks high.
Let’s start with the $IBB daily chart: from mid-November and after touching the weekly support line at 126.90, the price bounced up creating a new uptrend, but during the last two weeks of the year as the US markets was waiting for the Fiscal-Cliff solution, the price moved side-ways and gapped up on 12/31 after news of an agreement, which kept the positive momentum, reaching the 147.34 point- very close to the last 52 weeks high at 148.54. But looking at the indicators, we can see a clear “Negative Divergence” in the MACD and the RSI as well; moreover, the last uptrend was on a significant decreasing volume which shows that the bulls are not in full control any more.
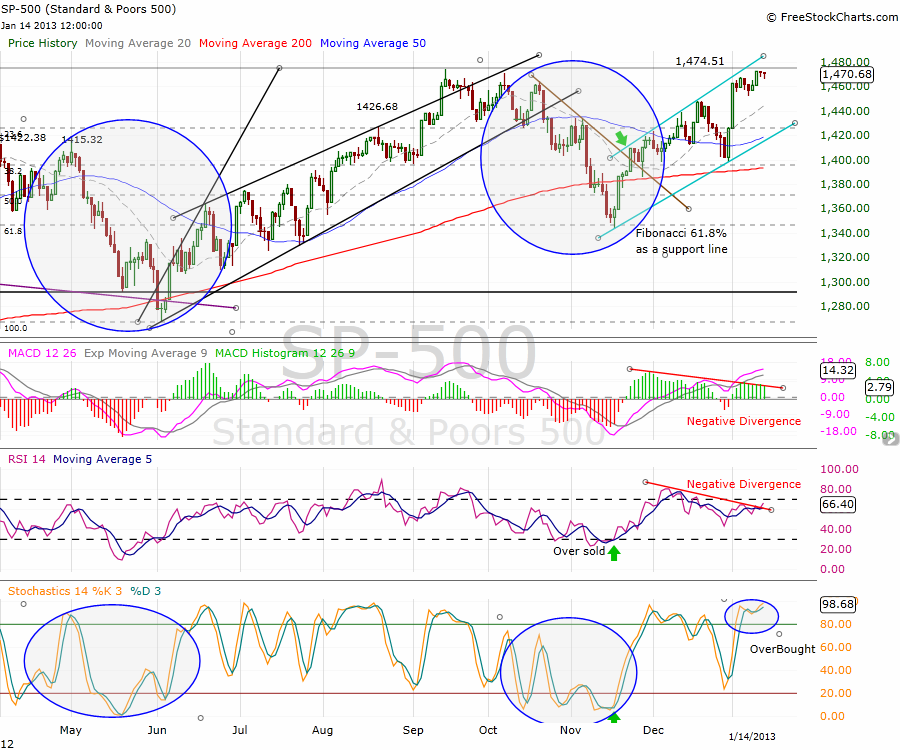
Along with the Biotechnology Index, we have to look at the broader markets, and the leading index is the $SPX (SP-500). It was an impressive bounce from the Fibonacci 61.8% retracement line; look at the area highlighted with the blue circle on the chart, comparing the previous chart ahead of the bounce (the upper $SPX chart) and the results in the chart bellow updated on 01/14/2013.
As I predicted, the price bounced up creating a new uptrend channel, exactly like the one that started at June 4th 2012 and ended on October 5th 2012.
In the last three trading days, the price almost touched the upper line of the Uptrend Channel and got very close to the last 52 weeks high of 1474.51, but as we saw in the $IBB index, the same weakness in the indicators as you can see on the chart, as the MACD and the RSI with a “Negative Divergence” as well. Moreover, the Stochastics is located deep in the overbought zone.
Is it the top?
The weakness in the indicators and reaching a new highs with negative divergence, give us a hint that a technical correction for the last uptrend is very close. In the $SPX we might see a correction to retest the lower line of the new Uptrend Channel (light blue lines at the chart) and the 50MA in the same area. In the $IBB we can get a technical correction, and retest of the last resistance line at 138.75. This line is supposed to change its role and be used as a support line.
On the other side, breaking out the last 52 weeks high with extremely large volume will keep the markets in the uptrend direction.


