
Sarepta Therapeutics, Inc. (SRPT)-Nasdaq
Sarepta is a biotech company under the spotlights since early October 2012, after presenting strong Phase IIb results for the compound Eteplirsen in the treatment of Duchenne Muscular Dystrophy. On October 3rd, 2012, SRPT jumped an unbelievable 199.7% by the closing bell, but as with every huge spike, profit taking started and the share price start dropping, reaching $21.21 on 10/31/2012.
Since the October drop, the price created a symmetrical triangle (blue lines); investors are looking for more information from SRPT as Patrick mentioned in his “Wednesday at the JP Morgan Healthcare Conference” piece:
CEO Chris Garabedian spoke infront of a packed crowd. Their presentation was largely focused on Eterplirsen in DMD and the next steps. He provided additional insight on their manufacturing progress and the next steps. They expect to meet with the FDA in Q1’13 to discuss the potential for accelerated approval; additionally they have a meeting to discuss CMC/manufacturing with FDA in Q2’13. We did happen to notice several pharma industry representatives in attendance, in particular, we saw some Pfizer and Biomarin.
Key events – Outcome of meeting with FDA in Q2(April?); potential ex-US partnership; updates on preclinical candidates
Daily Chart
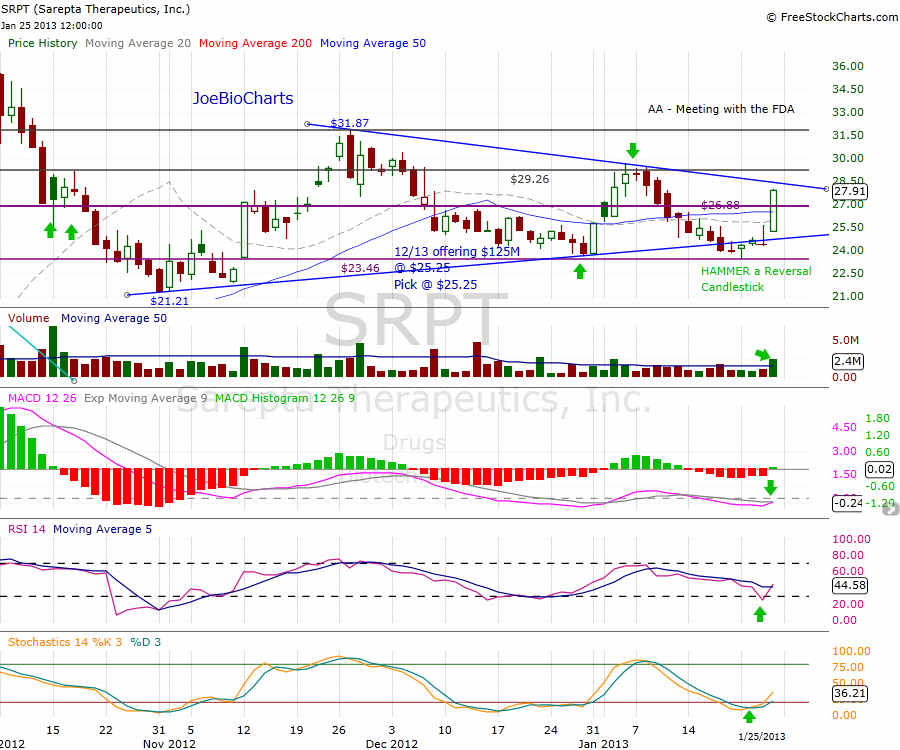
A Triangle pattern is considered to be a continuation or consolidation pattern, and as we can see on the chart above, the price is moving within a symmetrical triangle; the trading action gets tighter and tighter until the market breaks out with great force. During this period within the triangle, buyers and sellers are not sure where the market is headed. Their uncertainty is marked by their actions of buying and selling sooner, making the pattern look like an increasingly tight coil moving across the chart.
On 12/12/2012 Sarepta Announces Surprise Equity Offering, raising $125M at $25.25 per share. The news didn’t affect the price dramatically, and the share price kept trading side-way finding support at the weekly support line around $23.46.
The indicators started heading upward leaving the oversold area. The Stochastics breakout the 20 level line, and the RSI breakout the 30 level line and crossover the moving average as well, while the MACD is ready for the bullish crossover the signal line. After the “Bullish Hammer Candlestick” just on the support line, last Friday we had a large bullish green candlestick called White Marubozu, this candlestick means that the opening price is equal to the low price of the day and the closing price is equal to the high price of the day. This shows that the buyers controlled the price action from the first trade to the last trade and the sentiment is absolutely bullish.
What’s next
After the last run we might see some correction or a few days of trading side-way. But the sentiment throughout the chart is bullish. We need a continuation of the trend; moreover, the breakout of the triangle’s upper line support to be with a significantly increasing volume to insure a real breakout around the $28.30 area.
In case of the triangle breakout, the price have to deal with the next two resistance lines at $29.26 and the highest point of the triangle at $31.87, but the main price target investors are looking for is the last 52 weeks high of $45 that they are willing to see in case of good news from the FDA meeting, in the other side, in case of Accelerated Approval (AA) declined by the FDA, the share price will be under pressure.
Disclosure: The author long SRPT shares at the offering price.


