
Nasdaq Biotechnology Index Fund ETF (IBB)
The best indicator for our biotech portfolio are the biotechnology indexes like IBB, NBI, XBI or XLV. Since we already published “The IBB and SPX In The Decision Zone“, we will maintain our focus on the IBB.
By looking at the IBB daily chart, we get the whole picture of the latest epic run in the biotech sector, that we as investors or traders have experienced in the past 8 trading weeks. Printing a new 52 week high every second week, today we saw the new 52 week high as well at 177.07 points, but the index closed a bit lower creating a Doji candlestick the second day in a row, which shows indecision of the future direction, as it appears the bulls are no longer in control. The fight with the bears finished with no clear winner.
Daily Chart
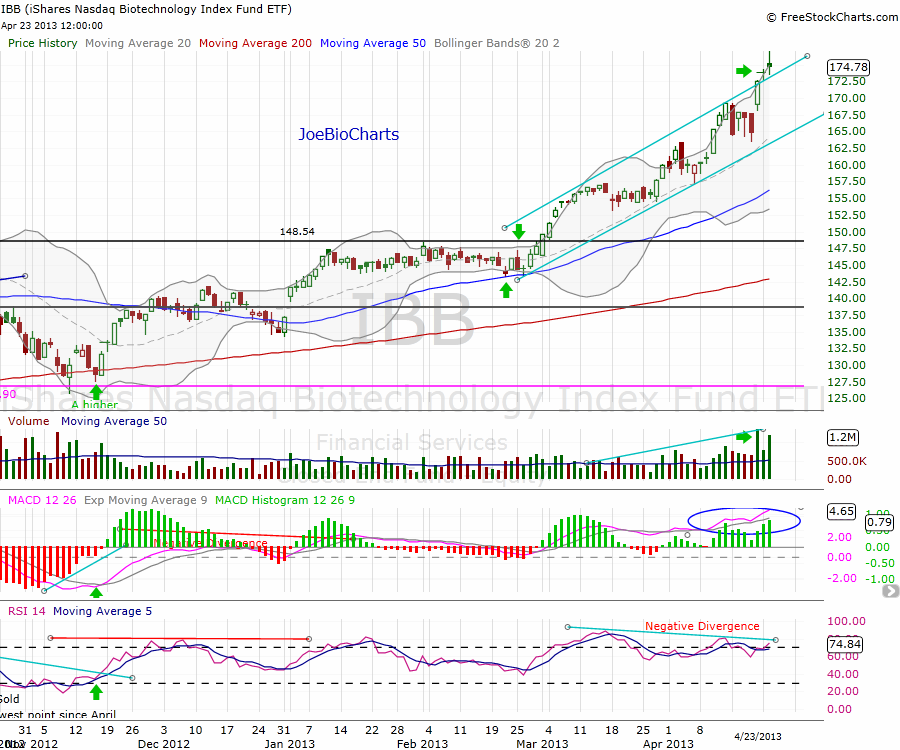
During the month of February IBB was trading sideways, in a very narrow horizontal channel (148.54 as the resistance line), but on March 1st, the price broke through the line with a long candlestick on increasing volume, giving the sign for the new run up, and started running upward within the uptrend channel (light blue lines on the chart). We can see that in any technical correction, the price found a support at the 20-day moving average (light gray line) along with the lower line of the channel.
The first sign of weakness that we can see on the chart is the price printing a new high while the RSI is in clear negative divergence. On the other side, the price broke out of the upper line of the channel on impressive increasing volume and closed above the line. This divergence created the last two Doji candlestick, a visual sign on the chart showing the indecision & hesitation at these levels.
What’s Next
If the index trades a few days sideways or continues to print a higher high, then we can ignore these red flags and enjoy the run. Signs of weakness that we have to consider and keep watching is a break down of the uptrend line, so we might have a technical correction, and the first support line is the lower line of the channel as well as the 20-day moving average which is a drop of 5% to 7%.
It currently appears ok to continue holding Long Term positions, but think of hedging — shorting the IBB (via Puts or short shares) can be a good way to protect a biotech portfolio.
Disclosure: the author have no position yet


