
Sarepta Therapeutics, Inc – Nasdaq(SRPT)
Quick update:
A big drop in SRPT today leaving the traders with speculation that there could be a leak about the decision to file for accelerated approval(AA) or not yet. For now, let’s take a look at the chart & check the technical standpoint.
Daily Chart
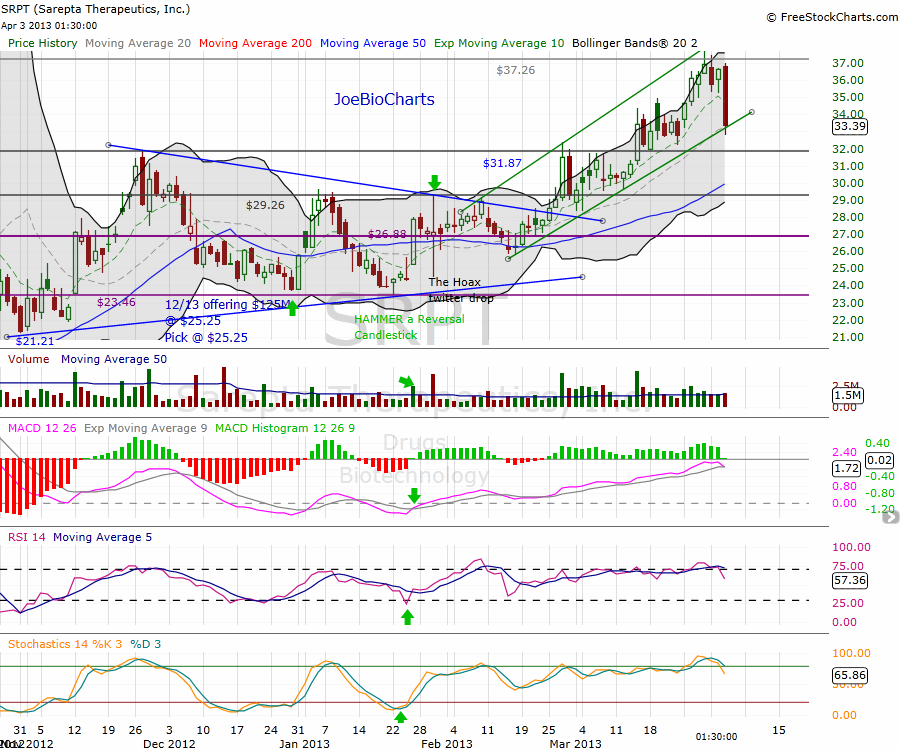
The price has been trading within an uptrend channel (green lines) starting at the low $25.80 and touching the resistance line at $37.26. It reached the high of $37.70, but closed below the resistance line.
Today’s price action can be viewed as a technical correction that might started by some profit taking that triggered stop losses, causing more pressure on the price. Reaching the 20-Day moving average and the lower line of the uptrend channel. Both are supposed to be used as strong support, moreover the drop is not with “significant” large volume, giving us the hint that it’s not a big funds liquidating their position to the open market.
I’m still holding my position, will wait to see the close today, and the continuation tomorrow. In case of a lower low, then we will have to watch the price closer; but in case of a bounce from the support lines, it will be a sign of stability around this price point.
Disclosure: Author long SRPT


