
Sarepta Therapeutics, Inc. (SRPT) – Nasdaq
After three years of a roller coaster, Sarepta getting closer to the the real deal, started with the NDA acceptance by the FDA on August 25th and a PDUFA date set on Feb 26th, 2016, but still waiting for the final date of the FDA Advisory Committee (AdCom) that supposed to take part of the “Peripheral and Central Nervous System Drugs Advisory Committee” which listed on a tentative calendar of advisory panels on November 23-24. The FDA final confirmation needed though.
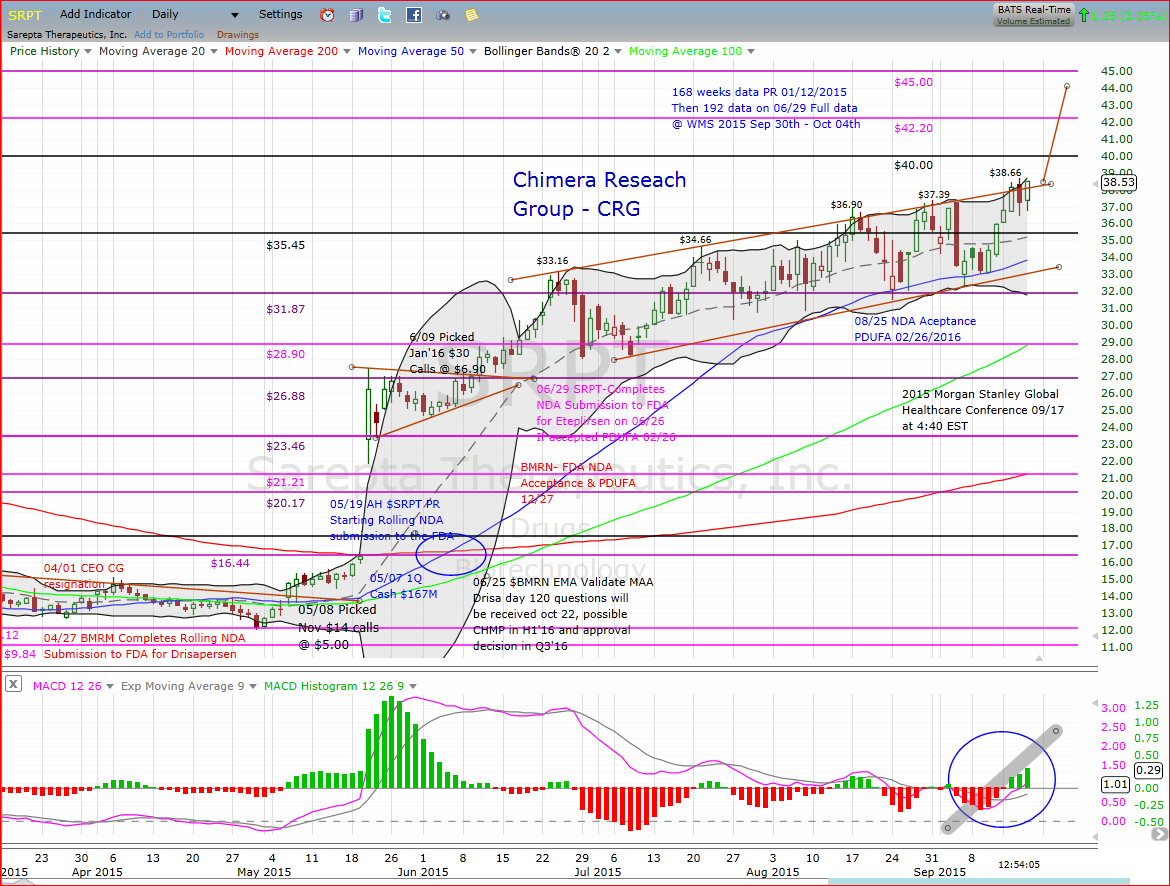
From the technical standpoint, during the past 3 months the price start trending within a predefined uptrend channel, kept printing a higher high and a lower low consistently, reaching a new 52 weeks high almost every week. Moreover, the 50-Day moving average had been used as a support line few times during the correction days. As we are getting closer to the next important catalyst, the World Muscle Society – WMS-2015 that is taking place in Brighton UK, Sarepta will disclose the results of the fourth biopsy data and the 192 Weeks 6MWT new data in October 1st, 2015. This data will be very important for Sarepta as it can play an important role in the AdCom vote beside all the parents & kids testimonies. A positive biopsy results and a stabilization in 6MWT would be a dream scenario, that can support a new run in the share price going towards the AdCom day, on the flip side, a negative data will put a heavy pressure on the share price as the chances of a positive AdCom vote getting slimmer.
Back to the technical standpoint, breaking out the uptrend channel need to be combined with an expanding volume to confirm the breakout, otherwise the chances of a correction are higher. After the breakout, we need a continuation candle which is a final confirmation of the breakout. The key to successful breakout is seeing a continuation of price activity in the direction of the breakout. Without this momentum, prices will reverse in most cases and stop breakout traders out of their position. The price target of the channel breakout is “at least” the depth of the channel, which in this case is around $5.30, so if the breakout is around the $38.15 today, then the target would be at least $43.45. The price have first to break through the old weekly resistance line at $42.20, if do so, then the next target will be the $45.00 line back from the year 2012 followed with $47.35.
Disclosure: Author is long SRPT


