
This is a different post in that I am going to be focusing on proprietary data and analysis. Below is summary of the findings and then I will talk more generally about the data. This should be of value and if there are particular ways in which you would like to see the data or questions you want answered please reach out to me (dsobek@sobekanalytics.com).
This is the first time we are presenting the obesity therapeutics landscape in a way that reflects how these drugs actually perform over time, rather than how they are typically marketed. Instead of focusing on headline weight loss at a single timepoint, the dataset brings together trajectory, tolerability, and responder depth into a single, comparable framework. The goal is simple: give you a cleaner way to see what is real, what is durable, and what is likely to matter commercially before the market fully prices it in.
The most important lens is the efficacy versus tolerability frontier. You can see, clearly and quantitatively, that higher weight loss is not free as it comes with increasing discontinuation. That tradeoff defines the competitive landscape more than any single efficacy number. What matters is not who posts the highest result, but who can push efficacy while keeping patients on drug. This is where differentiation actually lives, and it is where we expect the market to continue to misprice assets.
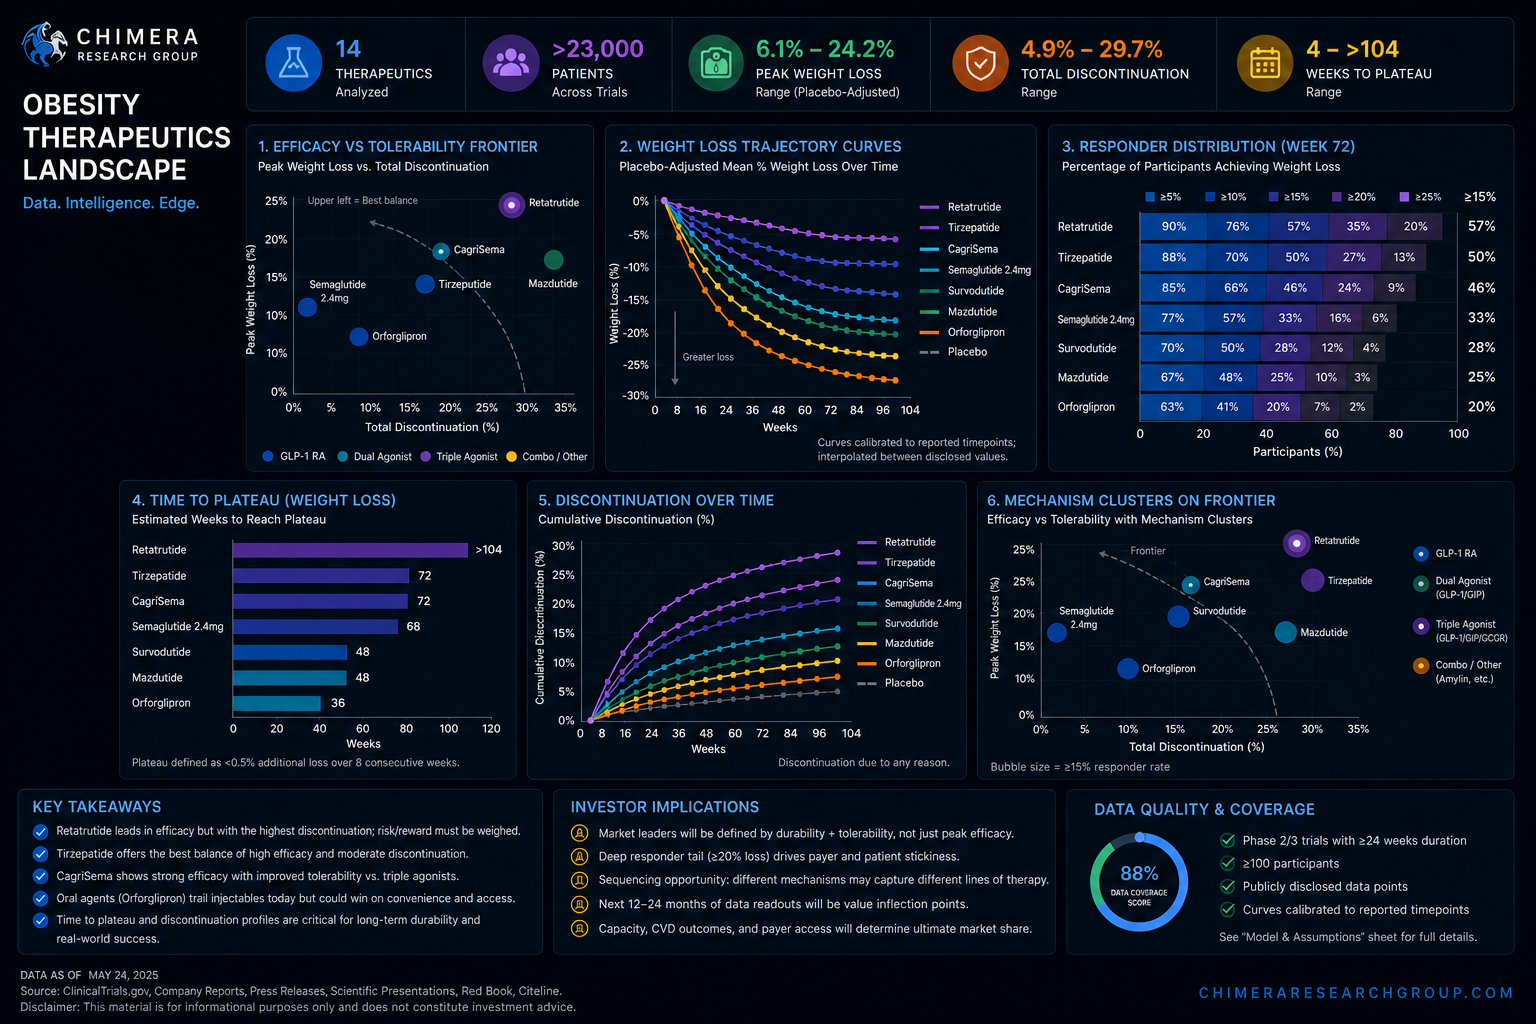
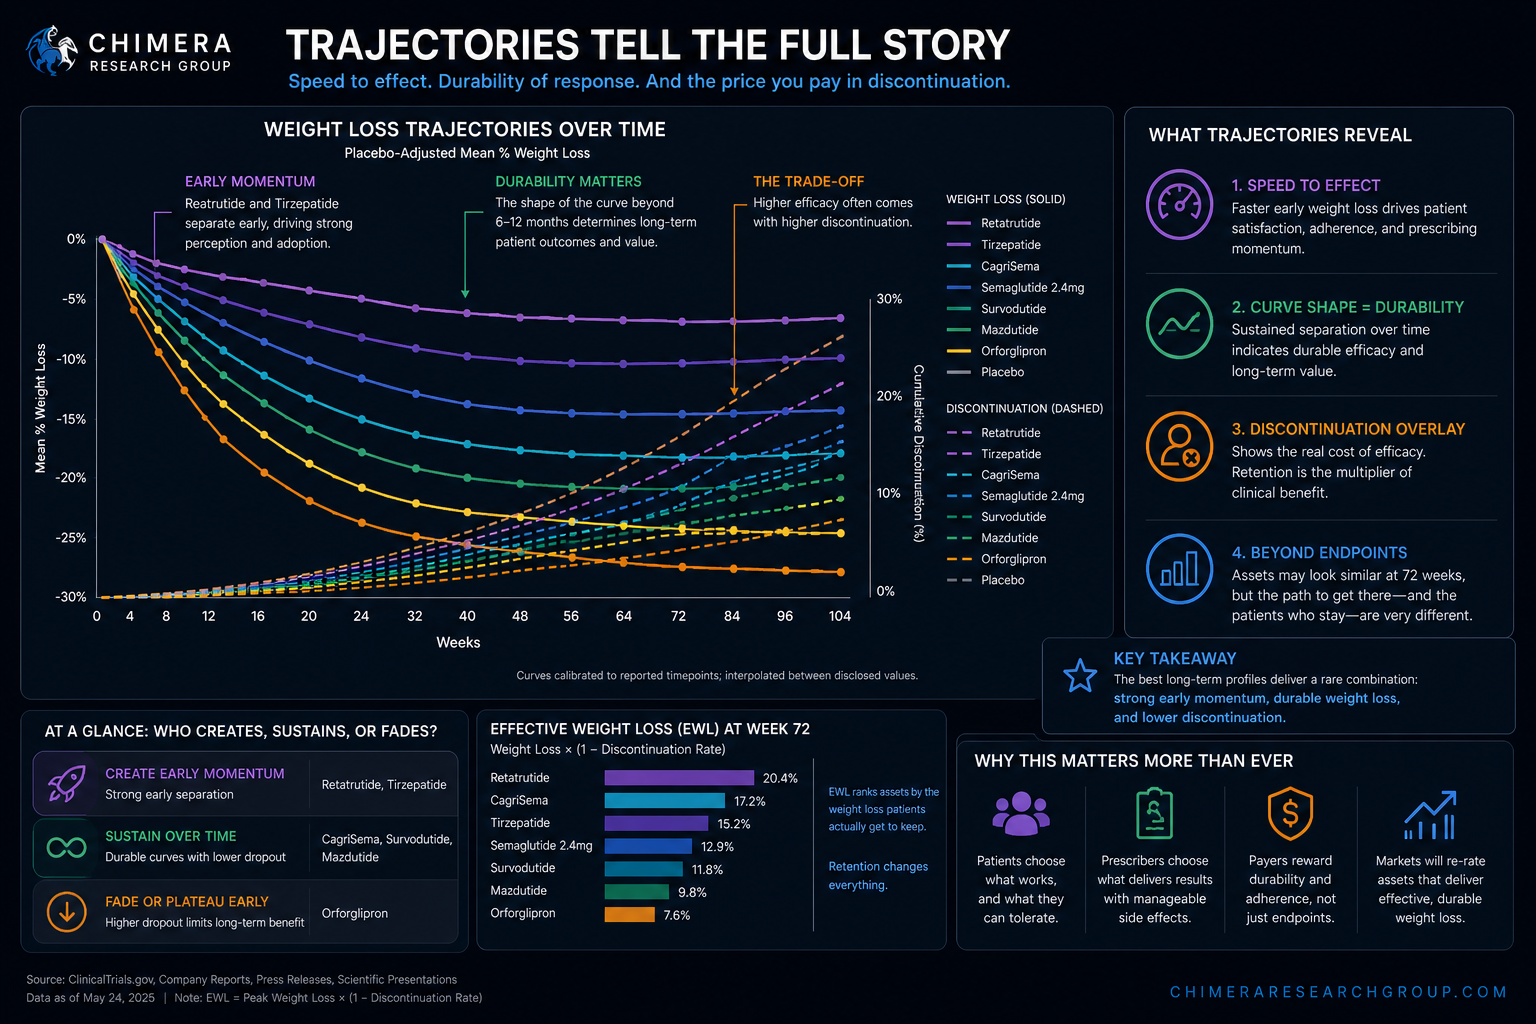
The trajectory curves add another layer that is easy to overlook but highly predictive. Speed to effect influences both patient perception and prescribing behavior, while the shape of the curve determines how durable that effect is. By aligning weight loss progression with discontinuation over time, you can start to see which assets create early momentum, which sustain it, and which fade. This becomes particularly important as more next-generation agents move through development and begin to look similar on endpoint alone.
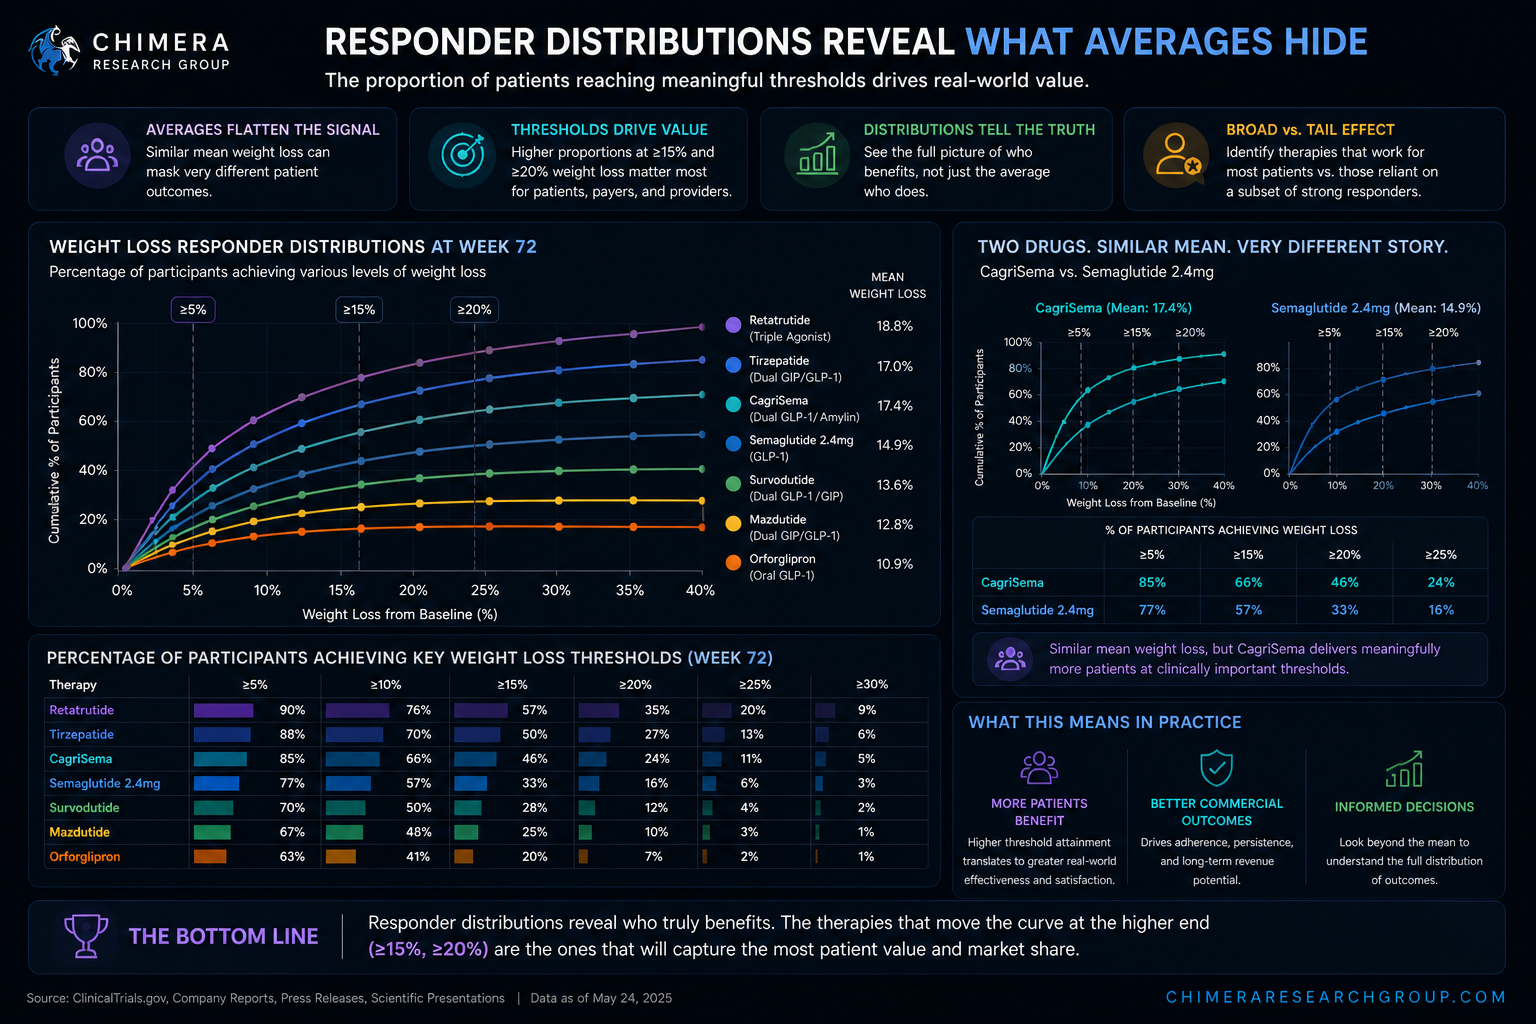
Responder distributions take this a step further. Averages flatten what is really happening underneath. What drives real-world value is the proportion of patients reaching meaningful thresholds—particularly at the higher end. Two drugs can look comparable on mean weight loss and behave very differently in practice. This view allows you to see that difference directly and assess whether a therapy is broadly effective or dependent on a subset of strong responders.
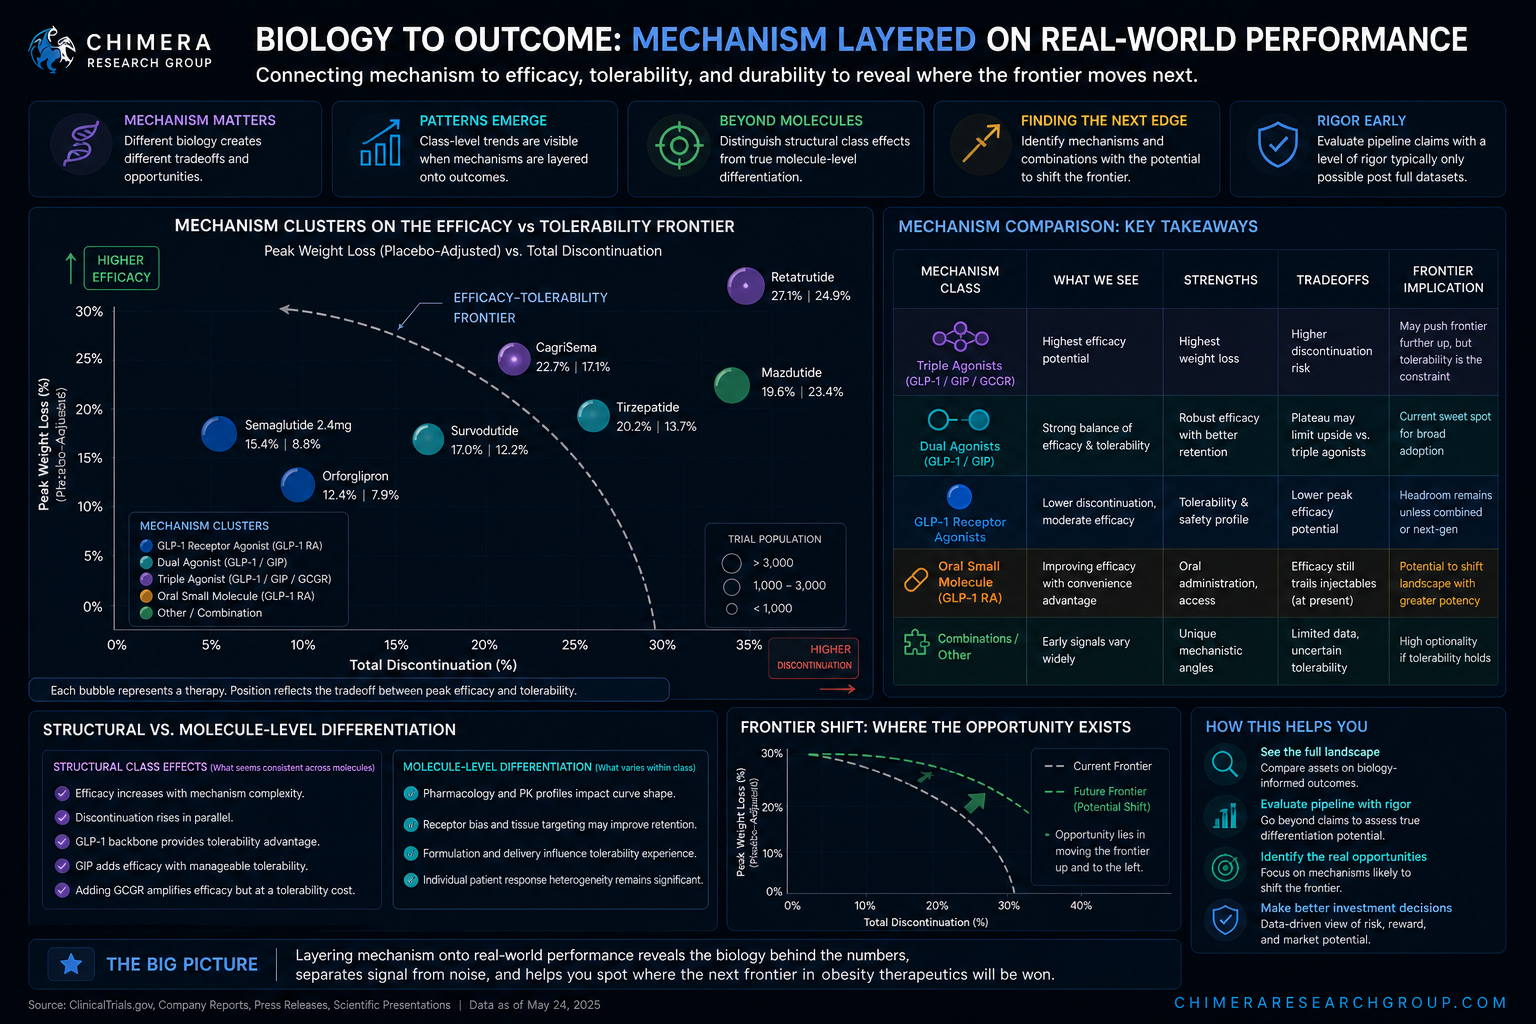
We have also layered mechanism directly onto the data so that you can connect biology to outcome. Patterns are already emerging across GLP-1s, dual agonists, and newer combinations, and they are not always intuitive. Some of what is being framed as molecule-level differentiation appears to be structural to the class, while other signals suggest where the frontier may actually move. This gives you a way to evaluate pipeline claims with a level of rigor that is usually only possible after full datasets are available.
The reason this matters now is that the obesity market is shifting from proof of concept to competition. Peak efficacy has largely been validated. The next phase will be defined by durability, adherence, and positioning across lines of therapy. The data here is designed to help you see that shift early—who is likely to win first-line, who captures long-term patient value, and where the current narrative diverges from what the underlying data is actually saying. As noted at the beginning, these sort of data and data analytics is where CRG is going so please let us know what is helpful and what you want to see next.


